Greek vs Eastern European Median Earnings
COMPARE
Greek
Eastern European
Median Earnings
Median Earnings Comparison
Greeks
Eastern Europeans
$51,164
MEDIAN EARNINGS
99.9/ 100
METRIC RATING
65th/ 347
METRIC RANK
$55,084
MEDIAN EARNINGS
100.0/ 100
METRIC RATING
17th/ 347
METRIC RANK
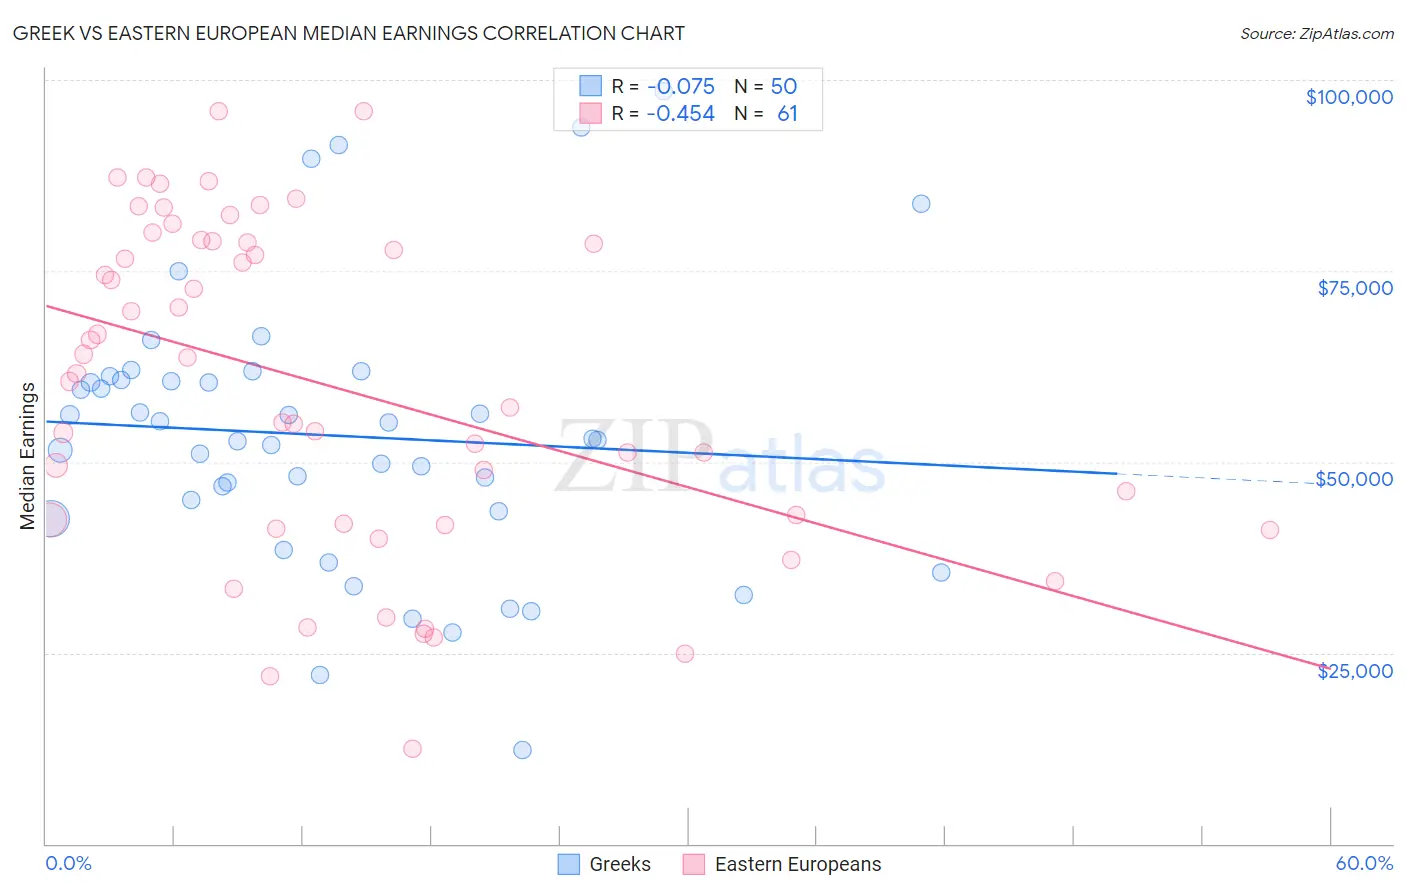
Greek vs Eastern European Median Earnings Correlation Chart
The statistical analysis conducted on geographies consisting of 482,719,843 people shows a slight negative correlation between the proportion of Greeks and median earnings in the United States with a correlation coefficient (R) of -0.075 and weighted average of $51,164. Similarly, the statistical analysis conducted on geographies consisting of 461,197,031 people shows a moderate negative correlation between the proportion of Eastern Europeans and median earnings in the United States with a correlation coefficient (R) of -0.454 and weighted average of $55,084, a difference of 7.7%.
Median Earnings Correlation Summary
| Measurement | Greek | Eastern European |
| Minimum | $12,321 | $12,500 |
| Maximum | $98,462 | $95,935 |
| Range | $86,141 | $83,435 |
| Mean | $53,439 | $59,916 |
| Median | $52,981 | $61,581 |
| Interquartile 25% (IQ1) | $43,544 | $41,817 |
| Interquartile 75% (IQ3) | $60,703 | $78,787 |
| Interquartile Range (IQR) | $17,159 | $36,970 |
| Standard Deviation (Sample) | $17,942 | $21,428 |
| Standard Deviation (Population) | $17,762 | $21,251 |
Similar Demographics by Median Earnings
Demographics Similar to Greeks by Median Earnings
In terms of median earnings, the demographic groups most similar to Greeks are Afghan ($51,112, a difference of 0.10%), Immigrants from Spain ($51,092, a difference of 0.14%), New Zealander ($51,246, a difference of 0.16%), Paraguayan ($51,068, a difference of 0.19%), and Mongolian ($51,038, a difference of 0.25%).
| Demographics | Rating | Rank | Median Earnings |
| Immigrants | Bolivia | 99.9 /100 | #58 | Exceptional $51,605 |
| Immigrants | Croatia | 99.9 /100 | #59 | Exceptional $51,581 |
| Immigrants | Serbia | 99.9 /100 | #60 | Exceptional $51,557 |
| Immigrants | Latvia | 99.9 /100 | #61 | Exceptional $51,555 |
| Immigrants | Romania | 99.9 /100 | #62 | Exceptional $51,337 |
| Immigrants | Bulgaria | 99.9 /100 | #63 | Exceptional $51,318 |
| New Zealanders | 99.9 /100 | #64 | Exceptional $51,246 |
| Greeks | 99.9 /100 | #65 | Exceptional $51,164 |
| Afghans | 99.9 /100 | #66 | Exceptional $51,112 |
| Immigrants | Spain | 99.9 /100 | #67 | Exceptional $51,092 |
| Paraguayans | 99.9 /100 | #68 | Exceptional $51,068 |
| Mongolians | 99.8 /100 | #69 | Exceptional $51,038 |
| Lithuanians | 99.8 /100 | #70 | Exceptional $50,991 |
| Immigrants | Ukraine | 99.8 /100 | #71 | Exceptional $50,984 |
| Immigrants | Egypt | 99.8 /100 | #72 | Exceptional $50,901 |
Demographics Similar to Eastern Europeans by Median Earnings
In terms of median earnings, the demographic groups most similar to Eastern Europeans are Immigrants from Japan ($54,938, a difference of 0.26%), Immigrants from Belgium ($54,679, a difference of 0.74%), Cypriot ($54,589, a difference of 0.91%), Burmese ($54,559, a difference of 0.96%), and Immigrants from Korea ($54,530, a difference of 1.0%).
| Demographics | Rating | Rank | Median Earnings |
| Immigrants | South Central Asia | 100.0 /100 | #10 | Exceptional $57,114 |
| Immigrants | Israel | 100.0 /100 | #11 | Exceptional $57,034 |
| Immigrants | Ireland | 100.0 /100 | #12 | Exceptional $56,854 |
| Immigrants | China | 100.0 /100 | #13 | Exceptional $56,638 |
| Immigrants | Australia | 100.0 /100 | #14 | Exceptional $56,305 |
| Indians (Asian) | 100.0 /100 | #15 | Exceptional $56,253 |
| Immigrants | Eastern Asia | 100.0 /100 | #16 | Exceptional $56,183 |
| Eastern Europeans | 100.0 /100 | #17 | Exceptional $55,084 |
| Immigrants | Japan | 100.0 /100 | #18 | Exceptional $54,938 |
| Immigrants | Belgium | 100.0 /100 | #19 | Exceptional $54,679 |
| Cypriots | 100.0 /100 | #20 | Exceptional $54,589 |
| Burmese | 100.0 /100 | #21 | Exceptional $54,559 |
| Immigrants | Korea | 100.0 /100 | #22 | Exceptional $54,530 |
| Immigrants | Sweden | 100.0 /100 | #23 | Exceptional $54,478 |
| Soviet Union | 100.0 /100 | #24 | Exceptional $54,290 |