Malaysian vs Immigrants from Ecuador Median Earnings
COMPARE
Malaysian
Immigrants from Ecuador
Median Earnings
Median Earnings Comparison
Malaysians
Immigrants from Ecuador
$43,844
MEDIAN EARNINGS
2.6/ 100
METRIC RATING
249th/ 347
METRIC RANK
$44,462
MEDIAN EARNINGS
5.9/ 100
METRIC RATING
237th/ 347
METRIC RANK
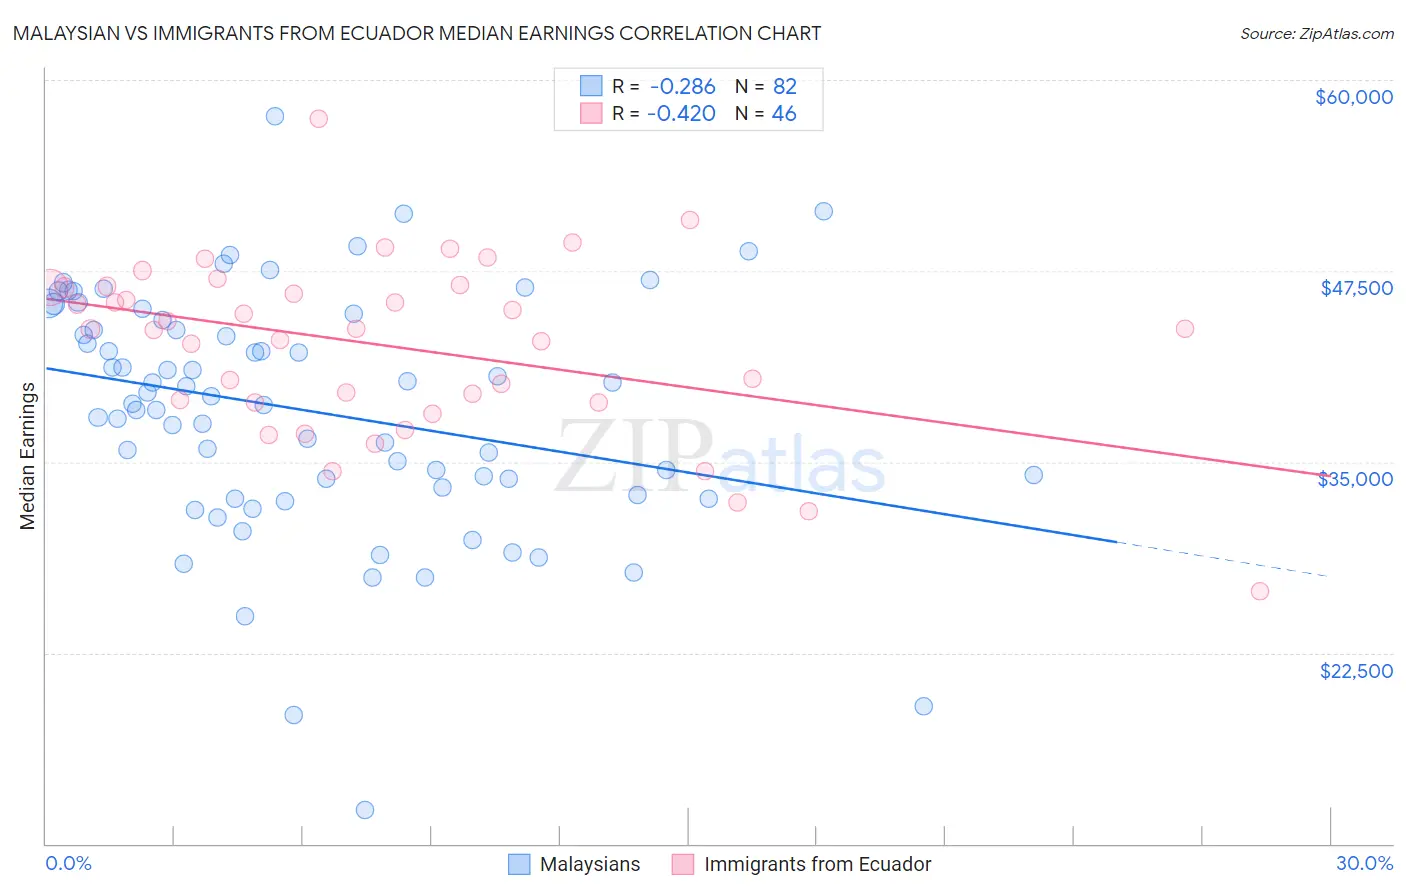
Malaysian vs Immigrants from Ecuador Median Earnings Correlation Chart
The statistical analysis conducted on geographies consisting of 226,109,286 people shows a weak negative correlation between the proportion of Malaysians and median earnings in the United States with a correlation coefficient (R) of -0.286 and weighted average of $43,844. Similarly, the statistical analysis conducted on geographies consisting of 271,003,938 people shows a moderate negative correlation between the proportion of Immigrants from Ecuador and median earnings in the United States with a correlation coefficient (R) of -0.420 and weighted average of $44,462, a difference of 1.4%.
Median Earnings Correlation Summary
| Measurement | Malaysian | Immigrants from Ecuador |
| Minimum | $12,196 | $26,500 |
| Maximum | $57,662 | $57,428 |
| Range | $45,466 | $30,928 |
| Mean | $38,334 | $42,586 |
| Median | $39,047 | $43,711 |
| Interquartile 25% (IQ1) | $33,295 | $38,859 |
| Interquartile 75% (IQ3) | $44,277 | $46,439 |
| Interquartile Range (IQR) | $10,982 | $7,579 |
| Standard Deviation (Sample) | $7,931 | $5,767 |
| Standard Deviation (Population) | $7,883 | $5,704 |
Demographics Similar to Malaysians and Immigrants from Ecuador by Median Earnings
In terms of median earnings, the demographic groups most similar to Malaysians are Nepalese ($43,860, a difference of 0.040%), Alaska Native ($43,750, a difference of 0.22%), Immigrants from Cabo Verde ($43,963, a difference of 0.27%), Immigrants from West Indies ($43,989, a difference of 0.33%), and Tsimshian ($43,695, a difference of 0.34%). Similarly, the demographic groups most similar to Immigrants from Ecuador are Sudanese ($44,419, a difference of 0.10%), British West Indian ($44,552, a difference of 0.20%), Senegalese ($44,373, a difference of 0.20%), Venezuelan ($44,580, a difference of 0.27%), and Cape Verdean ($44,640, a difference of 0.40%).
| Demographics | Rating | Rank | Median Earnings |
| Immigrants | Sudan | 8.8 /100 | #233 | Tragic $44,767 |
| Cape Verdeans | 7.5 /100 | #234 | Tragic $44,640 |
| Venezuelans | 6.9 /100 | #235 | Tragic $44,580 |
| British West Indians | 6.7 /100 | #236 | Tragic $44,552 |
| Immigrants | Ecuador | 5.9 /100 | #237 | Tragic $44,462 |
| Sudanese | 5.6 /100 | #238 | Tragic $44,419 |
| Senegalese | 5.3 /100 | #239 | Tragic $44,373 |
| Aleuts | 4.4 /100 | #240 | Tragic $44,241 |
| Samoans | 4.2 /100 | #241 | Tragic $44,206 |
| Immigrants | Venezuela | 4.0 /100 | #242 | Tragic $44,163 |
| Sub-Saharan Africans | 3.7 /100 | #243 | Tragic $44,118 |
| Immigrants | Nonimmigrants | 3.7 /100 | #244 | Tragic $44,117 |
| Immigrants | Burma/Myanmar | 3.2 /100 | #245 | Tragic $43,998 |
| Immigrants | West Indies | 3.1 /100 | #246 | Tragic $43,989 |
| Immigrants | Cabo Verde | 3.0 /100 | #247 | Tragic $43,963 |
| Nepalese | 2.6 /100 | #248 | Tragic $43,860 |
| Malaysians | 2.6 /100 | #249 | Tragic $43,844 |
| Alaska Natives | 2.3 /100 | #250 | Tragic $43,750 |
| Tsimshian | 2.1 /100 | #251 | Tragic $43,695 |
| Hawaiians | 2.0 /100 | #252 | Tragic $43,673 |
| Somalis | 1.8 /100 | #253 | Tragic $43,567 |