Luxembourger vs Immigrants from Germany Median Female Earnings
COMPARE
Luxembourger
Immigrants from Germany
Median Female Earnings
Median Female Earnings Comparison
Luxembourgers
Immigrants from Germany
$39,891
MEDIAN FEMALE EARNINGS
59.9/ 100
METRIC RATING
167th/ 347
METRIC RANK
$39,603
MEDIAN FEMALE EARNINGS
45.1/ 100
METRIC RATING
179th/ 347
METRIC RANK
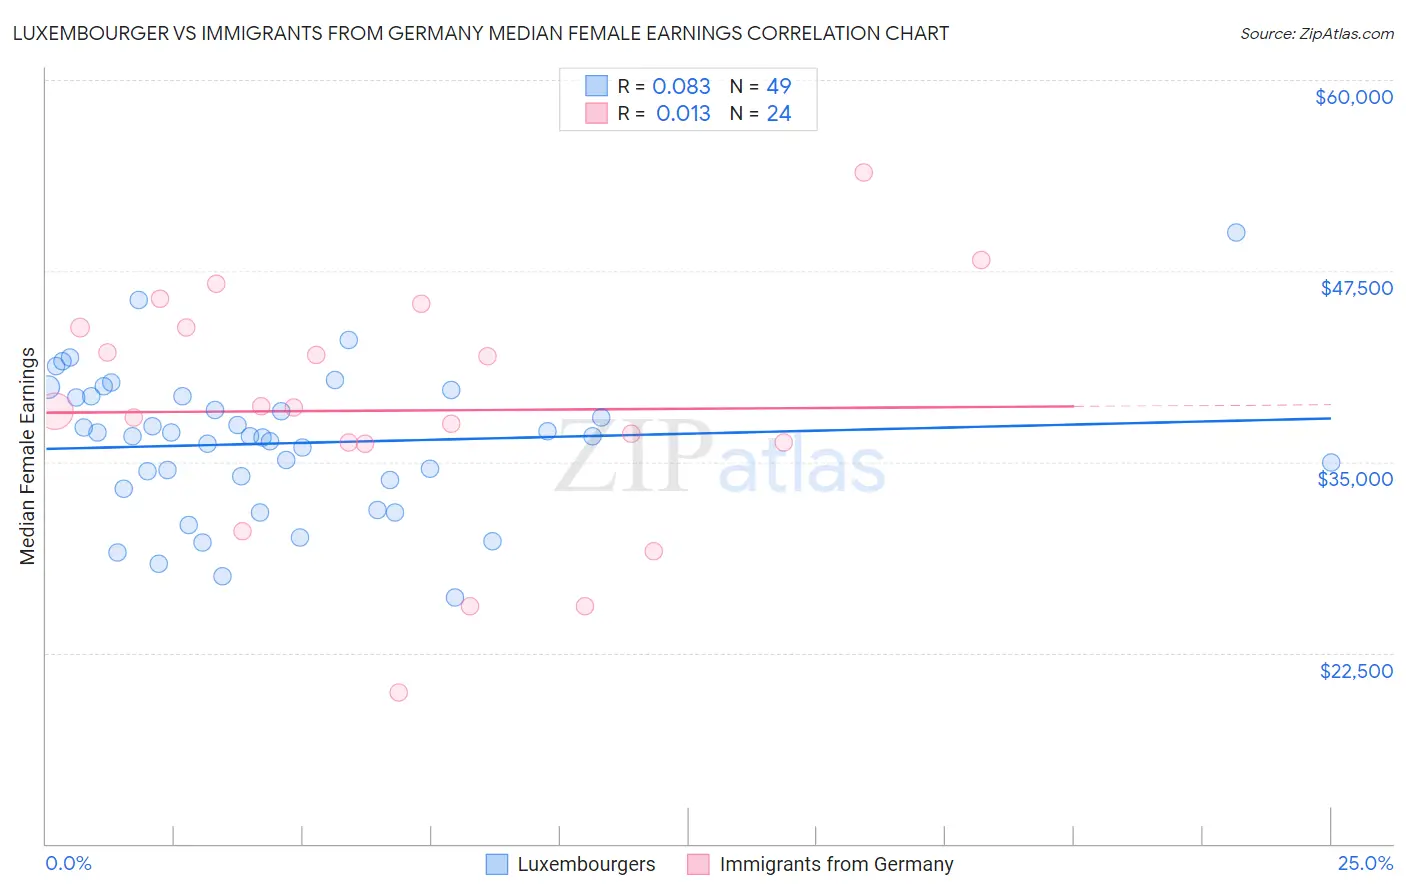
Luxembourger vs Immigrants from Germany Median Female Earnings Correlation Chart
The statistical analysis conducted on geographies consisting of 144,650,946 people shows a slight positive correlation between the proportion of Luxembourgers and median female earnings in the United States with a correlation coefficient (R) of 0.083 and weighted average of $39,891. Similarly, the statistical analysis conducted on geographies consisting of 463,482,548 people shows no correlation between the proportion of Immigrants from Germany and median female earnings in the United States with a correlation coefficient (R) of 0.013 and weighted average of $39,603, a difference of 0.73%.
Median Female Earnings Correlation Summary
| Measurement | Luxembourger | Immigrants from Germany |
| Minimum | $26,088 | $19,917 |
| Maximum | $50,000 | $53,929 |
| Range | $23,912 | $34,012 |
| Mean | $36,224 | $38,361 |
| Median | $36,648 | $38,420 |
| Interquartile 25% (IQ1) | $33,540 | $36,204 |
| Interquartile 75% (IQ3) | $39,298 | $43,786 |
| Interquartile Range (IQR) | $5,758 | $7,582 |
| Standard Deviation (Sample) | $4,701 | $7,917 |
| Standard Deviation (Population) | $4,653 | $7,751 |
Demographics Similar to Luxembourgers and Immigrants from Germany by Median Female Earnings
In terms of median female earnings, the demographic groups most similar to Luxembourgers are Immigrants from Ghana ($39,894, a difference of 0.010%), Immigrants from Bangladesh ($39,910, a difference of 0.050%), Immigrants from Peru ($39,871, a difference of 0.050%), Kenyan ($39,860, a difference of 0.080%), and Immigrants from Saudi Arabia ($39,952, a difference of 0.15%). Similarly, the demographic groups most similar to Immigrants from Germany are Slavic ($39,613, a difference of 0.030%), Costa Rican ($39,622, a difference of 0.050%), Immigrants from South America ($39,643, a difference of 0.10%), Nigerian ($39,641, a difference of 0.10%), and Immigrants from Kenya ($39,535, a difference of 0.17%).
| Demographics | Rating | Rank | Median Female Earnings |
| Lebanese | 65.5 /100 | #163 | Good $40,006 |
| Immigrants | Saudi Arabia | 62.9 /100 | #164 | Good $39,952 |
| Immigrants | Bangladesh | 60.8 /100 | #165 | Good $39,910 |
| Immigrants | Ghana | 60.0 /100 | #166 | Good $39,894 |
| Luxembourgers | 59.9 /100 | #167 | Average $39,891 |
| Immigrants | Peru | 58.9 /100 | #168 | Average $39,871 |
| Kenyans | 58.4 /100 | #169 | Average $39,860 |
| Slovenes | 56.2 /100 | #170 | Average $39,817 |
| Immigrants | Portugal | 54.7 /100 | #171 | Average $39,788 |
| British | 53.8 /100 | #172 | Average $39,772 |
| Canadians | 51.4 /100 | #173 | Average $39,724 |
| South Americans | 50.0 /100 | #174 | Average $39,698 |
| Immigrants | South America | 47.2 /100 | #175 | Average $39,643 |
| Nigerians | 47.0 /100 | #176 | Average $39,641 |
| Costa Ricans | 46.1 /100 | #177 | Average $39,622 |
| Slavs | 45.6 /100 | #178 | Average $39,613 |
| Immigrants | Germany | 45.1 /100 | #179 | Average $39,603 |
| Immigrants | Kenya | 41.6 /100 | #180 | Average $39,535 |
| Tsimshian | 41.4 /100 | #181 | Average $39,530 |
| Tlingit-Haida | 40.5 /100 | #182 | Average $39,513 |
| Hungarians | 40.3 /100 | #183 | Average $39,510 |