Ghanaian vs Immigrants from Germany Median Female Earnings
COMPARE
Ghanaian
Immigrants from Germany
Median Female Earnings
Median Female Earnings Comparison
Ghanaians
Immigrants from Germany
$40,429
MEDIAN FEMALE EARNINGS
82.1/ 100
METRIC RATING
146th/ 347
METRIC RANK
$39,603
MEDIAN FEMALE EARNINGS
45.1/ 100
METRIC RATING
179th/ 347
METRIC RANK
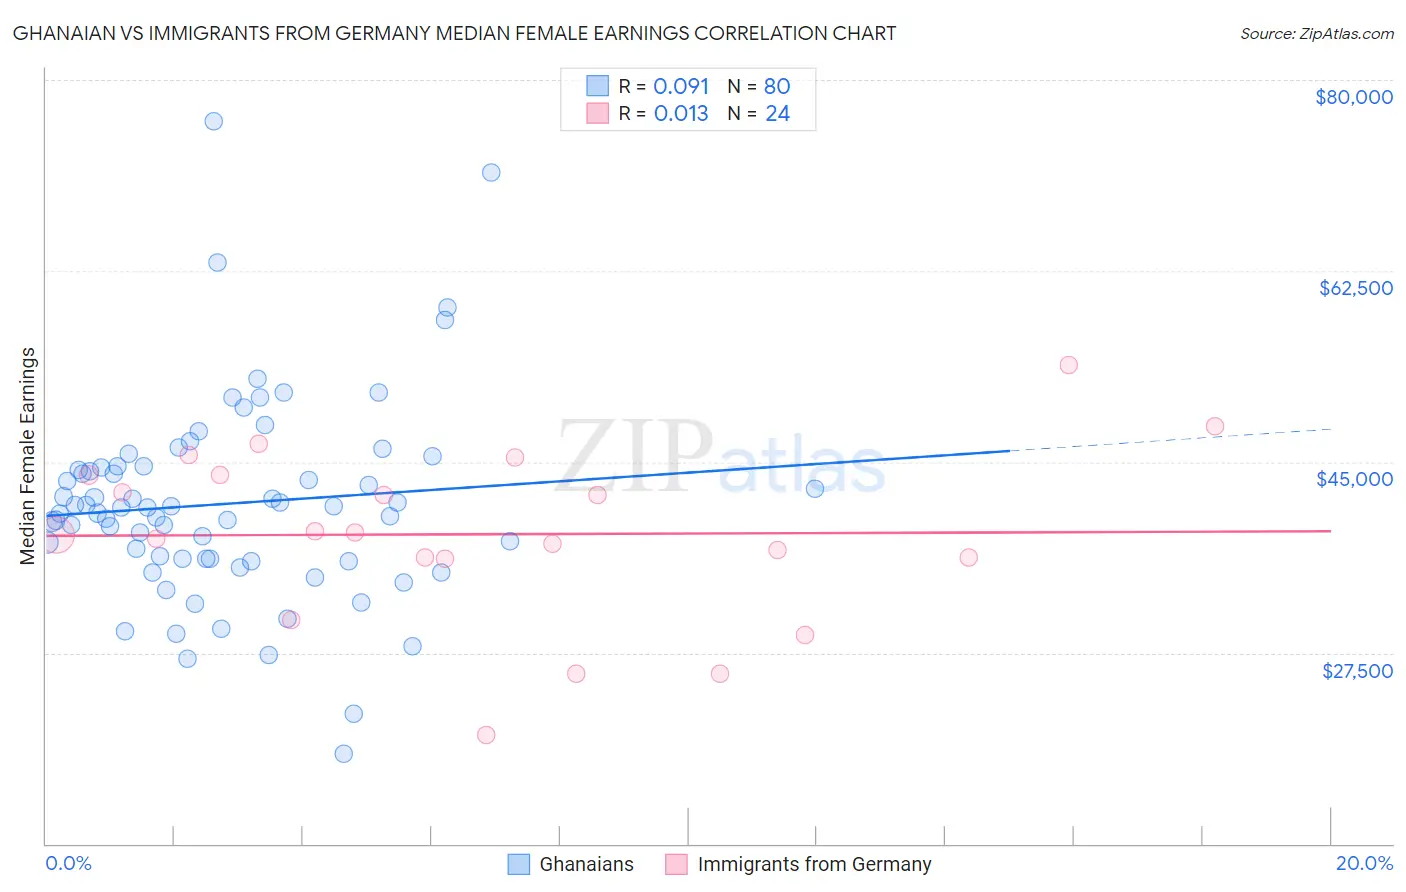
Ghanaian vs Immigrants from Germany Median Female Earnings Correlation Chart
The statistical analysis conducted on geographies consisting of 190,707,731 people shows a slight positive correlation between the proportion of Ghanaians and median female earnings in the United States with a correlation coefficient (R) of 0.091 and weighted average of $40,429. Similarly, the statistical analysis conducted on geographies consisting of 463,482,548 people shows no correlation between the proportion of Immigrants from Germany and median female earnings in the United States with a correlation coefficient (R) of 0.013 and weighted average of $39,603, a difference of 2.1%.
Median Female Earnings Correlation Summary
| Measurement | Ghanaian | Immigrants from Germany |
| Minimum | $18,266 | $19,917 |
| Maximum | $76,246 | $53,929 |
| Range | $57,980 | $34,012 |
| Mean | $41,171 | $38,361 |
| Median | $40,828 | $38,420 |
| Interquartile 25% (IQ1) | $36,123 | $36,204 |
| Interquartile 75% (IQ3) | $44,535 | $43,786 |
| Interquartile Range (IQR) | $8,413 | $7,582 |
| Standard Deviation (Sample) | $9,292 | $7,917 |
| Standard Deviation (Population) | $9,234 | $7,751 |
Similar Demographics by Median Female Earnings
Demographics Similar to Ghanaians by Median Female Earnings
In terms of median female earnings, the demographic groups most similar to Ghanaians are Brazilian ($40,483, a difference of 0.13%), Vietnamese ($40,377, a difference of 0.13%), Northern European ($40,491, a difference of 0.15%), Immigrants from North Macedonia ($40,488, a difference of 0.15%), and Polish ($40,371, a difference of 0.15%).
| Demographics | Rating | Rank | Median Female Earnings |
| Immigrants | South Eastern Asia | 85.7 /100 | #139 | Excellent $40,558 |
| Serbians | 85.2 /100 | #140 | Excellent $40,539 |
| Immigrants | Syria | 84.1 /100 | #141 | Excellent $40,499 |
| Sri Lankans | 84.0 /100 | #142 | Excellent $40,496 |
| Northern Europeans | 83.9 /100 | #143 | Excellent $40,491 |
| Immigrants | North Macedonia | 83.8 /100 | #144 | Excellent $40,488 |
| Brazilians | 83.6 /100 | #145 | Excellent $40,483 |
| Ghanaians | 82.1 /100 | #146 | Excellent $40,429 |
| Vietnamese | 80.4 /100 | #147 | Excellent $40,377 |
| Poles | 80.2 /100 | #148 | Excellent $40,371 |
| Immigrants | Cameroon | 79.7 /100 | #149 | Good $40,354 |
| Immigrants | Chile | 79.6 /100 | #150 | Good $40,353 |
| Immigrants | Armenia | 79.2 /100 | #151 | Good $40,340 |
| West Indians | 78.4 /100 | #152 | Good $40,317 |
| British West Indians | 77.7 /100 | #153 | Good $40,299 |
Demographics Similar to Immigrants from Germany by Median Female Earnings
In terms of median female earnings, the demographic groups most similar to Immigrants from Germany are Slavic ($39,613, a difference of 0.030%), Costa Rican ($39,622, a difference of 0.050%), Immigrants from South America ($39,643, a difference of 0.10%), Nigerian ($39,641, a difference of 0.10%), and Immigrants from Kenya ($39,535, a difference of 0.17%).
| Demographics | Rating | Rank | Median Female Earnings |
| British | 53.8 /100 | #172 | Average $39,772 |
| Canadians | 51.4 /100 | #173 | Average $39,724 |
| South Americans | 50.0 /100 | #174 | Average $39,698 |
| Immigrants | South America | 47.2 /100 | #175 | Average $39,643 |
| Nigerians | 47.0 /100 | #176 | Average $39,641 |
| Costa Ricans | 46.1 /100 | #177 | Average $39,622 |
| Slavs | 45.6 /100 | #178 | Average $39,613 |
| Immigrants | Germany | 45.1 /100 | #179 | Average $39,603 |
| Immigrants | Kenya | 41.6 /100 | #180 | Average $39,535 |
| Tsimshian | 41.4 /100 | #181 | Average $39,530 |
| Tlingit-Haida | 40.5 /100 | #182 | Average $39,513 |
| Hungarians | 40.3 /100 | #183 | Average $39,510 |
| Europeans | 37.7 /100 | #184 | Fair $39,457 |
| Immigrants | West Indies | 36.9 /100 | #185 | Fair $39,441 |
| Colombians | 36.9 /100 | #186 | Fair $39,439 |