Luxembourger vs Immigrants from Germany Doctorate Degree
COMPARE
Luxembourger
Immigrants from Germany
Doctorate Degree
Doctorate Degree Comparison
Luxembourgers
Immigrants from Germany
1.9%
DOCTORATE DEGREE
81.1/ 100
METRIC RATING
148th/ 347
METRIC RANK
2.1%
DOCTORATE DEGREE
97.3/ 100
METRIC RATING
108th/ 347
METRIC RANK
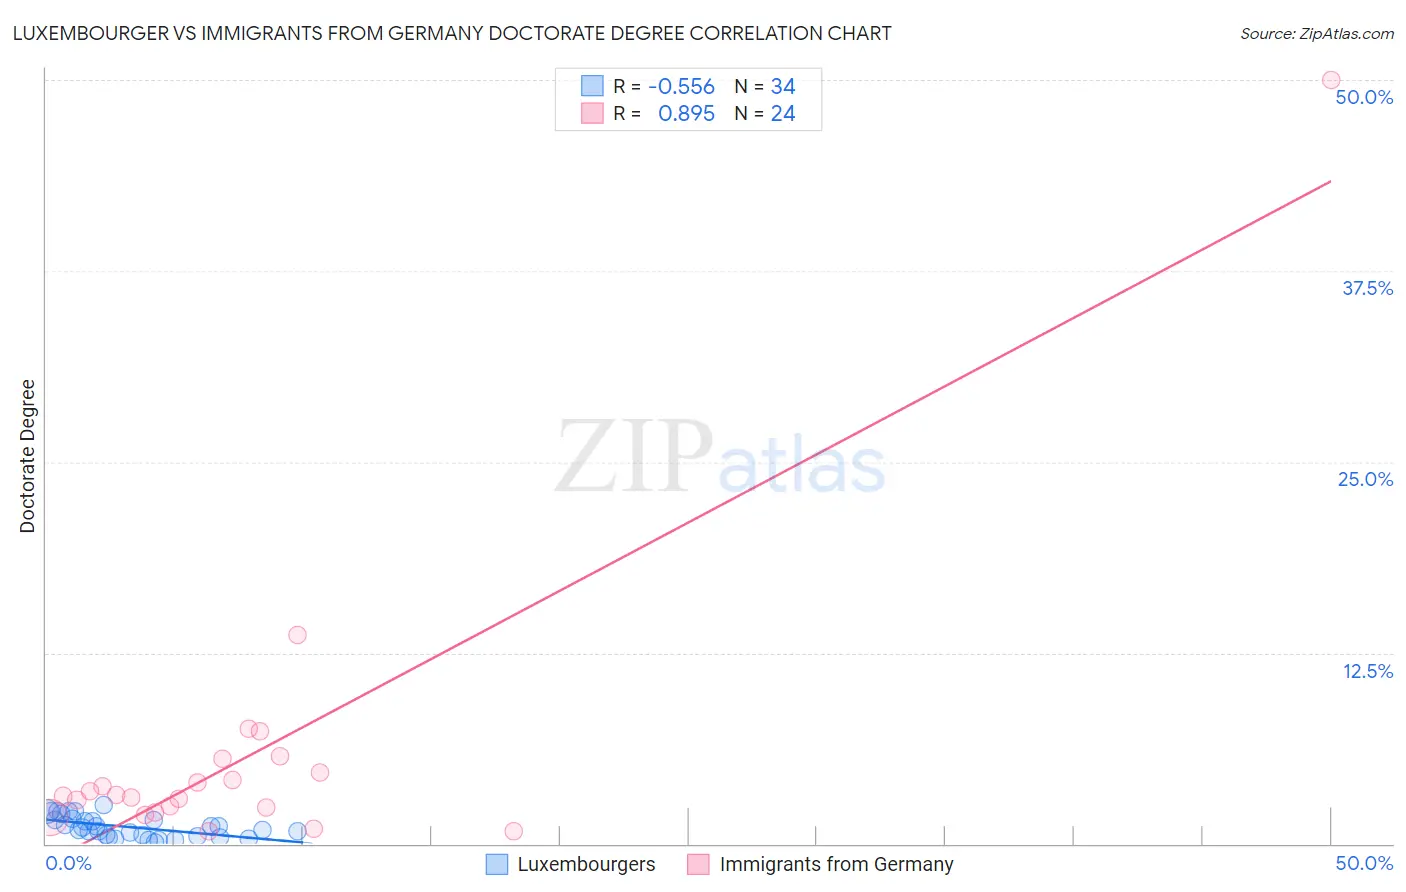
Luxembourger vs Immigrants from Germany Doctorate Degree Correlation Chart
The statistical analysis conducted on geographies consisting of 144,093,078 people shows a substantial negative correlation between the proportion of Luxembourgers and percentage of population with at least doctorate degree education in the United States with a correlation coefficient (R) of -0.556 and weighted average of 1.9%. Similarly, the statistical analysis conducted on geographies consisting of 457,324,098 people shows a very strong positive correlation between the proportion of Immigrants from Germany and percentage of population with at least doctorate degree education in the United States with a correlation coefficient (R) of 0.895 and weighted average of 2.1%, a difference of 7.4%.
Doctorate Degree Correlation Summary
| Measurement | Luxembourger | Immigrants from Germany |
| Minimum | 0.063% | 0.81% |
| Maximum | 2.6% | 50.0% |
| Range | 2.5% | 49.2% |
| Mean | 1.1% | 5.8% |
| Median | 0.98% | 3.1% |
| Interquartile 25% (IQ1) | 0.52% | 2.2% |
| Interquartile 75% (IQ3) | 1.6% | 5.1% |
| Interquartile Range (IQR) | 1.1% | 2.9% |
| Standard Deviation (Sample) | 0.70% | 9.8% |
| Standard Deviation (Population) | 0.69% | 9.6% |
Similar Demographics by Doctorate Degree
Demographics Similar to Luxembourgers by Doctorate Degree
In terms of doctorate degree, the demographic groups most similar to Luxembourgers are Immigrants from Senegal (1.9%, a difference of 0.33%), Immigrants from Syria (1.9%, a difference of 0.58%), Kenyan (1.9%, a difference of 0.60%), Immigrants from Moldova (2.0%, a difference of 0.78%), and Basque (1.9%, a difference of 0.90%).
| Demographics | Rating | Rank | Doctorate Degree |
| Senegalese | 86.7 /100 | #141 | Excellent 2.0% |
| Italians | 86.0 /100 | #142 | Excellent 2.0% |
| Sierra Leoneans | 85.1 /100 | #143 | Excellent 2.0% |
| Immigrants | Moldova | 84.3 /100 | #144 | Excellent 2.0% |
| Kenyans | 83.6 /100 | #145 | Excellent 1.9% |
| Immigrants | Syria | 83.6 /100 | #146 | Excellent 1.9% |
| Immigrants | Senegal | 82.5 /100 | #147 | Excellent 1.9% |
| Luxembourgers | 81.1 /100 | #148 | Excellent 1.9% |
| Basques | 76.9 /100 | #149 | Good 1.9% |
| English | 75.9 /100 | #150 | Good 1.9% |
| Albanians | 74.8 /100 | #151 | Good 1.9% |
| Immigrants | Kenya | 74.3 /100 | #152 | Good 1.9% |
| Immigrants | Oceania | 74.0 /100 | #153 | Good 1.9% |
| Immigrants | Albania | 72.8 /100 | #154 | Good 1.9% |
| Poles | 72.7 /100 | #155 | Good 1.9% |
Demographics Similar to Immigrants from Germany by Doctorate Degree
In terms of doctorate degree, the demographic groups most similar to Immigrants from Germany are Ukrainian (2.1%, a difference of 0.060%), Brazilian (2.1%, a difference of 0.13%), Immigrants from Pakistan (2.1%, a difference of 0.19%), Syrian (2.1%, a difference of 0.21%), and European (2.1%, a difference of 0.22%).
| Demographics | Rating | Rank | Doctorate Degree |
| Immigrants | Eastern Africa | 98.2 /100 | #101 | Exceptional 2.1% |
| Immigrants | Chile | 98.1 /100 | #102 | Exceptional 2.1% |
| Romanians | 98.1 /100 | #103 | Exceptional 2.1% |
| Austrians | 98.0 /100 | #104 | Exceptional 2.1% |
| Arabs | 97.8 /100 | #105 | Exceptional 2.1% |
| Sudanese | 97.7 /100 | #106 | Exceptional 2.1% |
| Europeans | 97.5 /100 | #107 | Exceptional 2.1% |
| Immigrants | Germany | 97.3 /100 | #108 | Exceptional 2.1% |
| Ukrainians | 97.2 /100 | #109 | Exceptional 2.1% |
| Brazilians | 97.2 /100 | #110 | Exceptional 2.1% |
| Immigrants | Pakistan | 97.1 /100 | #111 | Exceptional 2.1% |
| Syrians | 97.1 /100 | #112 | Exceptional 2.1% |
| Immigrants | Italy | 96.9 /100 | #113 | Exceptional 2.1% |
| Immigrants | Croatia | 96.8 /100 | #114 | Exceptional 2.1% |
| Taiwanese | 96.7 /100 | #115 | Exceptional 2.1% |