Jordanian vs Immigrants from Colombia Median Household Income
COMPARE
Jordanian
Immigrants from Colombia
Median Household Income
Median Household Income Comparison
Jordanians
Immigrants from Colombia
$91,794
MEDIAN HOUSEHOLD INCOME
98.7/ 100
METRIC RATING
96th/ 347
METRIC RANK
$83,902
MEDIAN HOUSEHOLD INCOME
31.7/ 100
METRIC RATING
189th/ 347
METRIC RANK
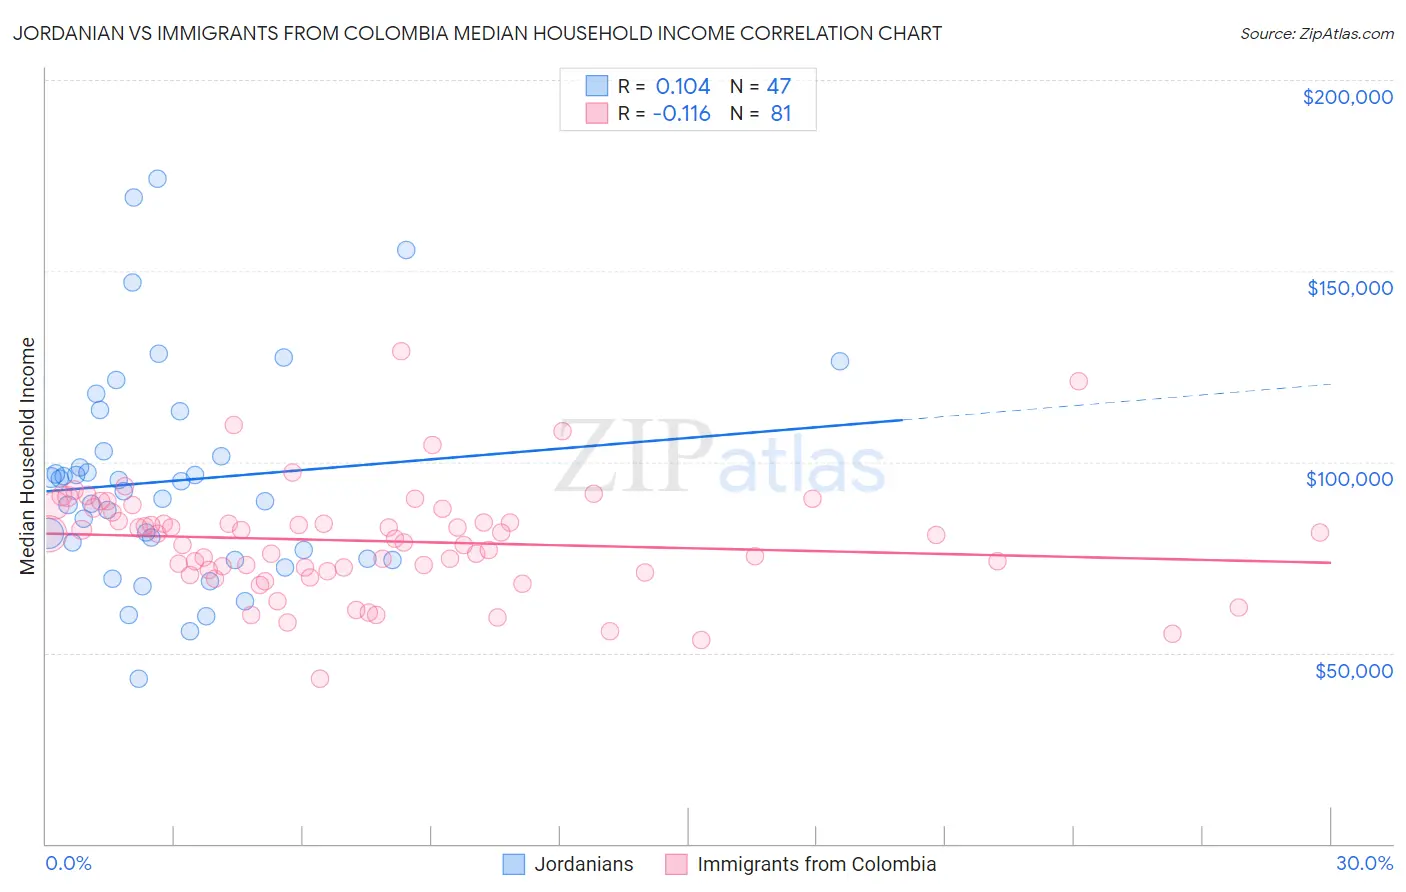
Jordanian vs Immigrants from Colombia Median Household Income Correlation Chart
The statistical analysis conducted on geographies consisting of 166,374,087 people shows a poor positive correlation between the proportion of Jordanians and median household income in the United States with a correlation coefficient (R) of 0.104 and weighted average of $91,794. Similarly, the statistical analysis conducted on geographies consisting of 378,453,155 people shows a poor negative correlation between the proportion of Immigrants from Colombia and median household income in the United States with a correlation coefficient (R) of -0.116 and weighted average of $83,902, a difference of 9.4%.
Median Household Income Correlation Summary
| Measurement | Jordanian | Immigrants from Colombia |
| Minimum | $43,214 | $43,124 |
| Maximum | $174,260 | $128,990 |
| Range | $131,046 | $85,865 |
| Mean | $95,049 | $79,298 |
| Median | $92,429 | $80,865 |
| Interquartile 25% (IQ1) | $74,643 | $71,504 |
| Interquartile 75% (IQ3) | $102,895 | $87,336 |
| Interquartile Range (IQR) | $28,252 | $15,833 |
| Standard Deviation (Sample) | $28,123 | $14,245 |
| Standard Deviation (Population) | $27,822 | $14,157 |
Similar Demographics by Median Household Income
Demographics Similar to Jordanians by Median Household Income
In terms of median household income, the demographic groups most similar to Jordanians are Armenian ($91,807, a difference of 0.010%), Immigrants from North America ($91,860, a difference of 0.070%), Immigrants from Serbia ($91,730, a difference of 0.070%), Immigrants from Lebanon ($91,887, a difference of 0.10%), and Immigrants from Western Europe ($91,936, a difference of 0.15%).
| Demographics | Rating | Rank | Median Household Income |
| Romanians | 98.8 /100 | #89 | Exceptional $91,994 |
| Assyrians/Chaldeans/Syriacs | 98.8 /100 | #90 | Exceptional $91,991 |
| Immigrants | Vietnam | 98.8 /100 | #91 | Exceptional $91,987 |
| Immigrants | Western Europe | 98.8 /100 | #92 | Exceptional $91,936 |
| Immigrants | Lebanon | 98.7 /100 | #93 | Exceptional $91,887 |
| Immigrants | North America | 98.7 /100 | #94 | Exceptional $91,860 |
| Armenians | 98.7 /100 | #95 | Exceptional $91,807 |
| Jordanians | 98.7 /100 | #96 | Exceptional $91,794 |
| Immigrants | Serbia | 98.6 /100 | #97 | Exceptional $91,730 |
| Immigrants | Southern Europe | 98.5 /100 | #98 | Exceptional $91,605 |
| Immigrants | South Eastern Asia | 98.4 /100 | #99 | Exceptional $91,541 |
| Ukrainians | 98.3 /100 | #100 | Exceptional $91,456 |
| Immigrants | Moldova | 98.3 /100 | #101 | Exceptional $91,446 |
| Austrians | 98.2 /100 | #102 | Exceptional $91,339 |
| Immigrants | Ukraine | 98.0 /100 | #103 | Exceptional $91,124 |
Demographics Similar to Immigrants from Colombia by Median Household Income
In terms of median household income, the demographic groups most similar to Immigrants from Colombia are Tlingit-Haida ($83,968, a difference of 0.080%), Slovak ($83,798, a difference of 0.12%), Puget Sound Salish ($84,011, a difference of 0.13%), Belgian ($84,008, a difference of 0.13%), and Iraqi ($83,753, a difference of 0.18%).
| Demographics | Rating | Rank | Median Household Income |
| Uruguayans | 43.5 /100 | #182 | Average $84,691 |
| Spaniards | 42.7 /100 | #183 | Average $84,644 |
| Immigrants | Eastern Africa | 37.4 /100 | #184 | Fair $84,299 |
| Kenyans | 34.2 /100 | #185 | Fair $84,085 |
| Puget Sound Salish | 33.2 /100 | #186 | Fair $84,011 |
| Belgians | 33.2 /100 | #187 | Fair $84,008 |
| Tlingit-Haida | 32.6 /100 | #188 | Fair $83,968 |
| Immigrants | Colombia | 31.7 /100 | #189 | Fair $83,902 |
| Slovaks | 30.2 /100 | #190 | Fair $83,798 |
| Iraqis | 29.6 /100 | #191 | Fair $83,753 |
| Welsh | 28.0 /100 | #192 | Fair $83,628 |
| Finns | 27.7 /100 | #193 | Fair $83,607 |
| Ghanaians | 27.4 /100 | #194 | Fair $83,582 |
| Immigrants | Armenia | 27.0 /100 | #195 | Fair $83,555 |
| French | 26.0 /100 | #196 | Fair $83,468 |