Israeli vs Yakama Median Household Income

COMPARE

Israeli
Race
Ancestry
AfghanAfricanAlaska NativeAlaskan AthabascanAlbanianAleutAlsatianAmericanApacheArabArapahoArgentineanArmenianAssyrian/Chaldean/SyriacAustralianAustrianBahamianBangladeshiBarbadianBasqueBelgianBelizeanBermudanBhutaneseBlackfeetBolivianBrazilianBritishBritish West IndianBulgarianBurmeseCajunCambodianCanadianCape VerdeanCarpatho RusynCelticCentral AmericanCentral American IndianCherokeeCheyenneChickasawChileanChineseChippewaChoctawColombianColvilleComancheCosta RicanCreeCreekCroatianCrowCubanCypriotCzechCzechoslovakianDanishDelawareDominicanDutchDutch West IndianEastern EuropeanEcuadorianEgyptianEnglishEstonianEthiopianEuropeanFijianFilipinoFinnishFrenchFrench American IndianFrench CanadianGermanGerman RussianGhanaianGreekGuamanian/ChamorroGuatemalanGuyaneseHaitianHmongHonduranHopiHoumaHungarianIcelanderIndian (Asian)IndonesianInupiatIranianIraqiIrishIroquoisIsraeliItalianJamaicanJapaneseJordanianKenyanKiowaKoreanLaotianLatvianLebaneseLiberianLithuanianLumbeeLuxembourgerMacedonianMalaysianMalteseMarshalleseMenomineeMexicanMexican American IndianMongolianMoroccanNative HawaiianNavajoNepaleseNew ZealanderNicaraguanNigerianNorthern EuropeanNorwegianOkinawanOsageOttawaPaiutePakistaniPalestinianPanamanianParaguayanPennsylvania GermanPeruvianPimaPolishPortuguesePotawatomiPuebloPuerto RicanPuget Sound SalishRomanianRussianSalvadoranSamoanScandinavianScotch-IrishScottishSeminoleSenegaleseSerbianShoshoneSierra LeoneanSiouxSlavicSlovakSloveneSomaliSouth AfricanSouth AmericanSouth American IndianSoviet UnionSpaniardSpanishSpanish AmericanSpanish American IndianSri LankanSubsaharan AfricanSudaneseSwedishSwissSyrianTaiwaneseThaiTlingit-HaidaTohono O'OdhamTonganTrinidadian and TobagonianTsimshianTurkishU.S. Virgin IslanderUgandanUkrainianUruguayanUteVenezuelanVietnameseWelshWest IndianYaquiYugoslavianYumanYup'ikZimbabwean
Immigration
NonimmigrantsImmigrantsAfghanistanAfricaAlbaniaArgentinaArmeniaAsiaAustraliaAustriaBahamasBangladeshBarbadosBelarusBelgiumBelizeBoliviaBosnia and HerzegovinaBrazilBulgariaBurma/MyanmarCabo VerdeCambodiaCameroonCanadaCaribbeanCentral AmericaChileChinaColombiaCongoCosta RicaCroatiaCubaCzechoslovakiaDenmarkDominicaDominican RepublicEastern AfricaEastern AsiaEastern EuropeEcuadorEgyptEl SalvadorEnglandEritreaEthiopiaEuropeFijiFranceGermanyGhanaGreeceGrenadaGuatemalaGuyanaHaitiHondurasHong KongHungaryIndiaIndonesiaIranIraqIrelandIsraelItalyJamaicaJapanJordanKazakhstanKenyaKoreaKuwaitLaosLatin AmericaLatviaLebanonLiberiaLithuaniaMalaysiaMexicoMicronesiaMiddle AfricaMoldovaMoroccoNepalNetherlandsNicaraguaNigeriaNorth AmericaNorth MacedoniaNorthern AfricaNorthern EuropeNorwayOceaniaPakistanPanamaPeruPhilippinesPolandPortugalRomaniaRussiaSaudi ArabiaScotlandSenegalSerbiaSierra LeoneSingaporeSomaliaSouth AfricaSouth AmericaSouth Central AsiaSouth Eastern AsiaSouthern EuropeSpainSri LankaSt. Vincent and the GrenadinesSudanSwedenSwitzerlandSyriaTaiwanThailandTrinidad and TobagoTurkeyUgandaUkraineUruguayUzbekistanVenezuelaVietnamWest IndiesWestern AfricaWestern AsiaWestern EuropeYemenZaireZimbabweAzores
Yakama
Race
Ancestry
AfghanAfricanAlaska NativeAlaskan AthabascanAlbanianAleutAlsatianAmericanApacheArabArapahoArgentineanArmenianAssyrian/Chaldean/SyriacAustralianAustrianBahamianBangladeshiBarbadianBasqueBelgianBelizeanBermudanBhutaneseBlackfeetBolivianBrazilianBritishBritish West IndianBulgarianBurmeseCajunCambodianCanadianCape VerdeanCarpatho RusynCelticCentral AmericanCentral American IndianCherokeeCheyenneChickasawChileanChineseChippewaChoctawColombianColvilleComancheCosta RicanCreeCreekCroatianCrowCubanCypriotCzechCzechoslovakianDanishDelawareDominicanDutchDutch West IndianEastern EuropeanEcuadorianEgyptianEnglishEstonianEthiopianEuropeanFijianFilipinoFinnishFrenchFrench American IndianFrench CanadianGermanGerman RussianGhanaianGreekGuamanian/ChamorroGuatemalanGuyaneseHaitianHmongHonduranHopiHoumaHungarianIcelanderIndian (Asian)IndonesianInupiatIranianIraqiIrishIroquoisItalianJamaicanJapaneseJordanianKenyanKiowaKoreanLaotianLatvianLebaneseLiberianLithuanianLumbeeLuxembourgerMacedonianMalaysianMalteseMarshalleseMenomineeMexicanMexican American IndianMongolianMoroccanNative HawaiianNavajoNepaleseNew ZealanderNicaraguanNigerianNorthern EuropeanNorwegianOkinawanOsageOttawaPaiutePakistaniPalestinianPanamanianParaguayanPennsylvania GermanPeruvianPimaPolishPortuguesePotawatomiPuebloPuerto RicanPuget Sound SalishRomanianRussianSalvadoranSamoanScandinavianScotch-IrishScottishSeminoleSenegaleseSerbianShoshoneSierra LeoneanSiouxSlavicSlovakSloveneSomaliSouth AfricanSouth AmericanSouth American IndianSoviet UnionSpaniardSpanishSpanish AmericanSpanish American IndianSri LankanSubsaharan AfricanSudaneseSwedishSwissSyrianTaiwaneseThaiTlingit-HaidaTohono O'OdhamTonganTrinidadian and TobagonianTsimshianTurkishU.S. Virgin IslanderUgandanUkrainianUruguayanUteVenezuelanVietnameseWelshWest IndianYakamaYaquiYugoslavianYumanYup'ikZimbabwean
Immigration
NonimmigrantsImmigrantsAfghanistanAfricaAlbaniaArgentinaArmeniaAsiaAustraliaAustriaBahamasBangladeshBarbadosBelarusBelgiumBelizeBoliviaBosnia and HerzegovinaBrazilBulgariaBurma/MyanmarCabo VerdeCambodiaCameroonCanadaCaribbeanCentral AmericaChileChinaColombiaCongoCosta RicaCroatiaCubaCzechoslovakiaDenmarkDominicaDominican RepublicEastern AfricaEastern AsiaEastern EuropeEcuadorEgyptEl SalvadorEnglandEritreaEthiopiaEuropeFijiFranceGermanyGhanaGreeceGrenadaGuatemalaGuyanaHaitiHondurasHong KongHungaryIndiaIndonesiaIranIraqIrelandIsraelItalyJamaicaJapanJordanKazakhstanKenyaKoreaKuwaitLaosLatin AmericaLatviaLebanonLiberiaLithuaniaMalaysiaMexicoMicronesiaMiddle AfricaMoldovaMoroccoNepalNetherlandsNicaraguaNigeriaNorth AmericaNorth MacedoniaNorthern AfricaNorthern EuropeNorwayOceaniaPakistanPanamaPeruPhilippinesPolandPortugalRomaniaRussiaSaudi ArabiaScotlandSenegalSerbiaSierra LeoneSingaporeSomaliaSouth AfricaSouth AmericaSouth Central AsiaSouth Eastern AsiaSouthern EuropeSpainSri LankaSt. Vincent and the GrenadinesSudanSwedenSwitzerlandSyriaTaiwanThailandTrinidad and TobagoTurkeyUgandaUkraineUruguayUzbekistanVenezuelaVietnamWest IndiesWestern AfricaWestern AsiaWestern EuropeYemenZaireZimbabweAzores
Median Household Income
Income
Poverty
Unemployment
Labor Participation
Family Structure
Vehicle Availability
Education Level
Disability

Median Household Income Comparison

Israelis

Yakama

Exceptional
Tragic
$96,552
MEDIAN HOUSEHOLD INCOME
99.9/ 100
METRIC RATING
45th/ 347
METRIC RANK
$72,225
MEDIAN HOUSEHOLD INCOME
0.0/ 100
METRIC RATING
308th/ 347
METRIC RANK

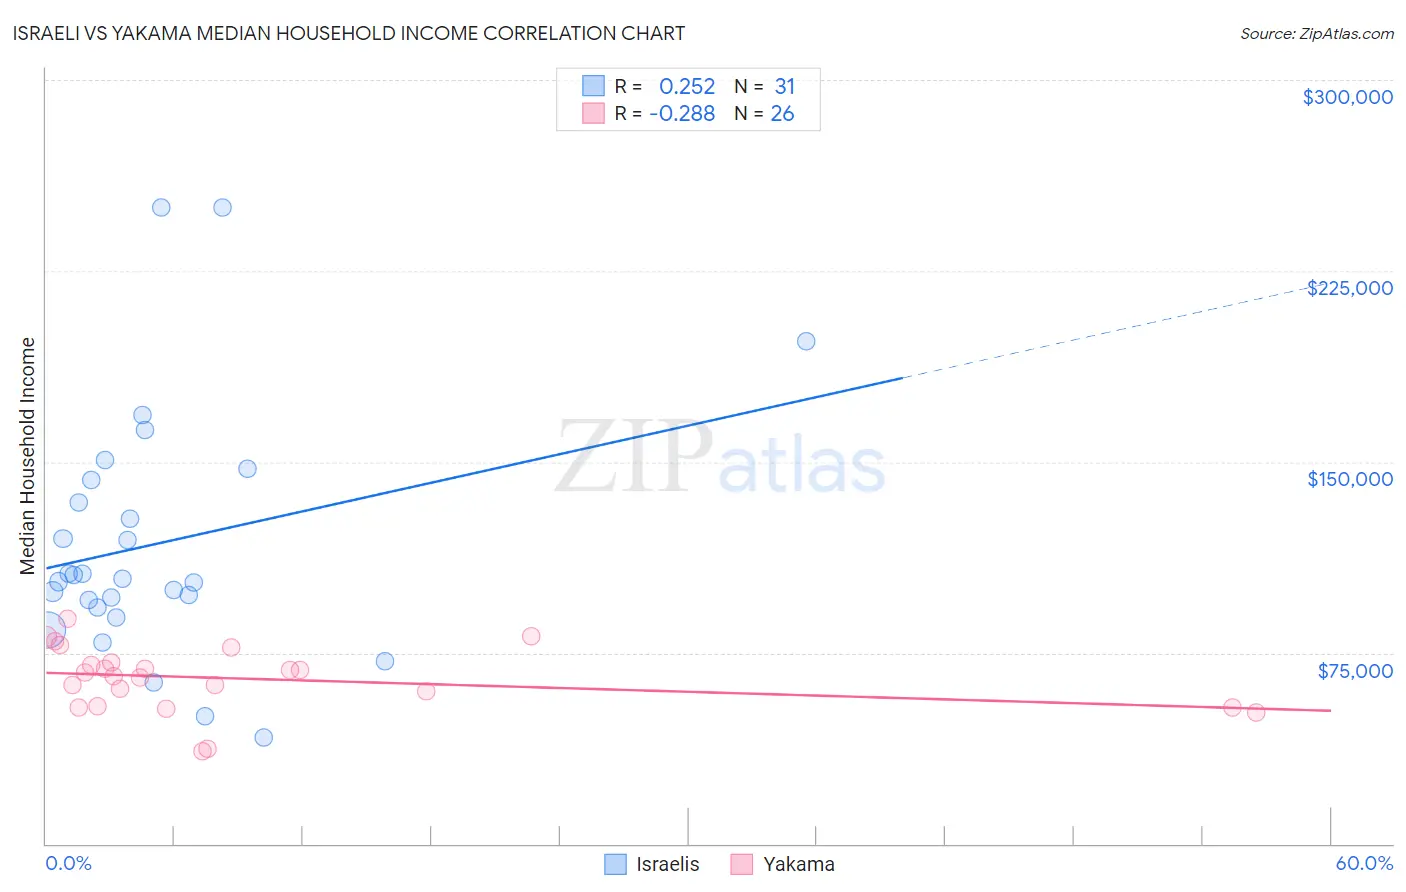
Israeli vs Yakama Median Household Income Correlation Chart

The statistical analysis conducted on geographies consisting of 210,971,551 people shows a weak positive correlation between the proportion of Israelis and median household income in the United States with a correlation coefficient (R) of 0.252 and weighted average of $96,552. Similarly, the statistical analysis conducted on geographies consisting of 19,909,650 people shows a weak negative correlation between the proportion of Yakama and median household income in the United States with a correlation coefficient (R) of -0.288 and weighted average of $72,225, a difference of 33.7%.
Israeli vs Yakama Median Household Income

Median Household Income Correlation Summary

MeasurementIsraeliYakama
Minimum$41,875$36,563
Maximum$250,001$88,202
Range$208,126$51,639
Mean$117,996$64,818
Median$104,190$66,477
Interquartile 25% (IQ1)$92,986$54,107
Interquartile 75% (IQ3)$142,824$71,429
Interquartile Range (IQR)$49,838$17,322
Standard Deviation (Sample)$48,790$12,734
Standard Deviation (Population)$47,997$12,487

Similar Demographics by Median Household Income

Demographics Similar to Israelis by Median Household Income

In terms of median household income, the demographic groups most similar to Israelis are Australian ($96,490, a difference of 0.060%), Immigrants from Greece ($96,675, a difference of 0.13%), Immigrants from Russia ($96,378, a difference of 0.18%), Immigrants from France ($96,743, a difference of 0.20%), and Cambodian ($96,324, a difference of 0.24%).
DemographicsRating | RankMedian Household Income
Immigrants | Indonesia
100.0
/100
|
#38
Exceptional
$97,297
Afghans
100.0
/100
|
#39
Exceptional
$97,026
Maltese
100.0
/100
|
#40
Exceptional
$97,015
Immigrants | Turkey
100.0
/100
|
#41
Exceptional
$96,964
Immigrants | Lithuania
99.9
/100
|
#42
Exceptional
$96,836
Immigrants | France
99.9
/100
|
#43
Exceptional
$96,743
Immigrants | Greece
99.9
/100
|
#44
Exceptional
$96,675
Israelis
99.9
/100
|
#45
Exceptional
$96,552
Australians
99.9
/100
|
#46
Exceptional
$96,490
Immigrants | Russia
99.9
/100
|
#47
Exceptional
$96,378
Cambodians
99.9
/100
|
#48
Exceptional
$96,324
Immigrants | Malaysia
99.9
/100
|
#49
Exceptional
$96,292
Bulgarians
99.9
/100
|
#50
Exceptional
$96,290
Estonians
99.9
/100
|
#51
Exceptional
$95,930
Immigrants | South Africa
99.9
/100
|
#52
Exceptional
$95,800

Demographics Similar to Yakama by Median Household Income

In terms of median household income, the demographic groups most similar to Yakama are Ute ($72,402, a difference of 0.25%), Potawatomi ($72,576, a difference of 0.49%), Honduran ($72,588, a difference of 0.50%), Immigrants from Caribbean ($71,860, a difference of 0.51%), and Immigrants from Haiti ($72,599, a difference of 0.52%).
DemographicsRating | RankMedian Household Income
Cherokee
0.0
/100
|
#301
Tragic
$72,682
Shoshone
0.0
/100
|
#302
Tragic
$72,660
Africans
0.0
/100
|
#303
Tragic
$72,650
Immigrants | Haiti
0.0
/100
|
#304
Tragic
$72,599
Hondurans
0.0
/100
|
#305
Tragic
$72,588
Potawatomi
0.0
/100
|
#306
Tragic
$72,576
Ute
0.0
/100
|
#307
Tragic
$72,402
Yakama
0.0
/100
|
#308
Tragic
$72,225
Immigrants | Caribbean
0.0
/100
|
#309
Tragic
$71,860
U.S. Virgin Islanders
0.0
/100
|
#310
Tragic
$71,853
Immigrants | Zaire
0.0
/100
|
#311
Tragic
$71,801
Immigrants | Honduras
0.0
/100
|
#312
Tragic
$71,452
Immigrants | Bahamas
0.0
/100
|
#313
Tragic
$71,349
Dominicans
0.0
/100
|
#314
Tragic
$71,302
Ottawa
0.0
/100
|
#315
Tragic
$70,984