Immigrants vs Immigrants from Portugal Median Family Income
COMPARE
Immigrants
Immigrants from Portugal
Median Family Income
Median Family Income Comparison
Immigrants
Immigrants from Portugal
$100,962
MEDIAN FAMILY INCOME
29.4/ 100
METRIC RATING
190th/ 347
METRIC RANK
$100,984
MEDIAN FAMILY INCOME
29.6/ 100
METRIC RATING
189th/ 347
METRIC RANK
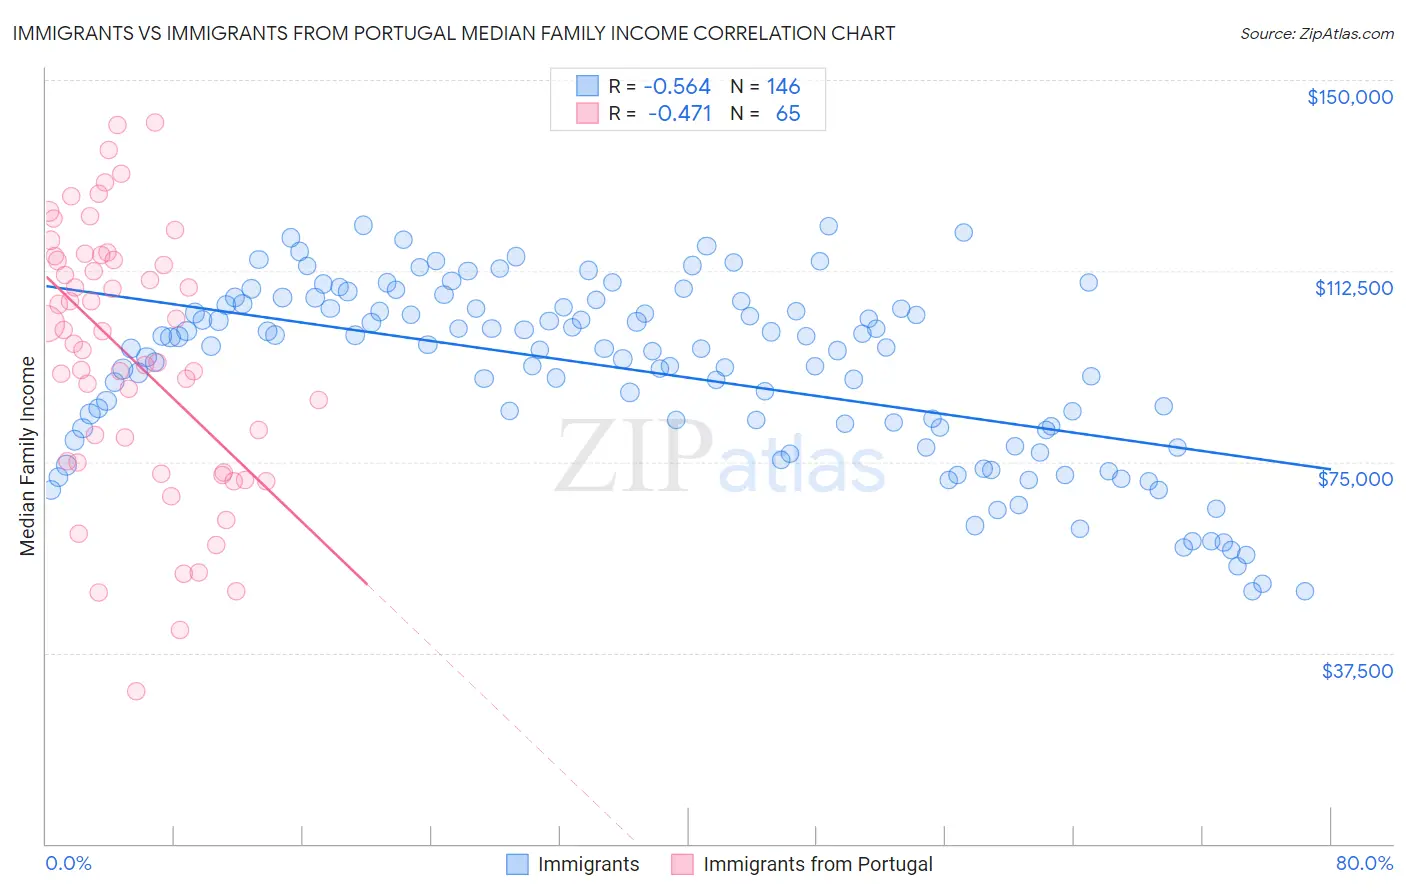
Immigrants vs Immigrants from Portugal Median Family Income Correlation Chart
The statistical analysis conducted on geographies consisting of 575,657,782 people shows a substantial negative correlation between the proportion of Immigrants and median family income in the United States with a correlation coefficient (R) of -0.564 and weighted average of $100,962. Similarly, the statistical analysis conducted on geographies consisting of 174,753,640 people shows a moderate negative correlation between the proportion of Immigrants from Portugal and median family income in the United States with a correlation coefficient (R) of -0.471 and weighted average of $100,984, a difference of 0.020%.
Median Family Income Correlation Summary
| Measurement | Immigrants | Immigrants from Portugal |
| Minimum | $49,547 | $29,911 |
| Maximum | $121,425 | $141,703 |
| Range | $71,878 | $111,792 |
| Mean | $92,890 | $95,434 |
| Median | $97,277 | $98,112 |
| Interquartile 25% (IQ1) | $81,623 | $73,840 |
| Interquartile 75% (IQ3) | $105,367 | $114,950 |
| Interquartile Range (IQR) | $23,744 | $41,110 |
| Standard Deviation (Sample) | $17,448 | $25,863 |
| Standard Deviation (Population) | $17,388 | $25,663 |
Demographics Similar to Immigrants and Immigrants from Portugal by Median Family Income
In terms of median family income, the demographic groups most similar to Immigrants are Guamanian/Chamorro ($101,061, a difference of 0.10%), Tlingit-Haida ($101,092, a difference of 0.13%), Celtic ($101,139, a difference of 0.18%), Colombian ($100,750, a difference of 0.21%), and Dutch ($101,192, a difference of 0.23%). Similarly, the demographic groups most similar to Immigrants from Portugal are Guamanian/Chamorro ($101,061, a difference of 0.080%), Tlingit-Haida ($101,092, a difference of 0.11%), Celtic ($101,139, a difference of 0.15%), Dutch ($101,192, a difference of 0.21%), and Colombian ($100,750, a difference of 0.23%).
| Demographics | Rating | Rank | Median Family Income |
| South Americans | 39.7 /100 | #179 | Fair $101,856 |
| French Canadians | 37.0 /100 | #180 | Fair $101,634 |
| Spaniards | 36.8 /100 | #181 | Fair $101,617 |
| Tsimshian | 35.9 /100 | #182 | Fair $101,543 |
| Kenyans | 34.5 /100 | #183 | Fair $101,417 |
| Immigrants | Costa Rica | 33.7 /100 | #184 | Fair $101,354 |
| Dutch | 31.9 /100 | #185 | Fair $101,192 |
| Celtics | 31.3 /100 | #186 | Fair $101,139 |
| Tlingit-Haida | 30.8 /100 | #187 | Fair $101,092 |
| Guamanians/Chamorros | 30.5 /100 | #188 | Fair $101,061 |
| Immigrants | Portugal | 29.6 /100 | #189 | Fair $100,984 |
| Immigrants | Immigrants | 29.4 /100 | #190 | Fair $100,962 |
| Colombians | 27.2 /100 | #191 | Fair $100,750 |
| Immigrants | Kenya | 26.5 /100 | #192 | Fair $100,679 |
| Iraqis | 26.3 /100 | #193 | Fair $100,658 |
| Uruguayans | 26.3 /100 | #194 | Fair $100,656 |
| Immigrants | South America | 23.9 /100 | #195 | Fair $100,414 |
| Samoans | 23.3 /100 | #196 | Fair $100,344 |
| Immigrants | Cameroon | 22.8 /100 | #197 | Fair $100,289 |
| Immigrants | Africa | 22.5 /100 | #198 | Fair $100,256 |
| Yugoslavians | 21.3 /100 | #199 | Fair $100,119 |