Immigrants vs Immigrants from Portugal Per Capita Income
COMPARE
Immigrants
Immigrants from Portugal
Per Capita Income
Per Capita Income Comparison
Immigrants
Immigrants from Portugal
$43,010
PER CAPITA INCOME
32.5/ 100
METRIC RATING
185th/ 347
METRIC RANK
$42,412
PER CAPITA INCOME
19.7/ 100
METRIC RATING
198th/ 347
METRIC RANK
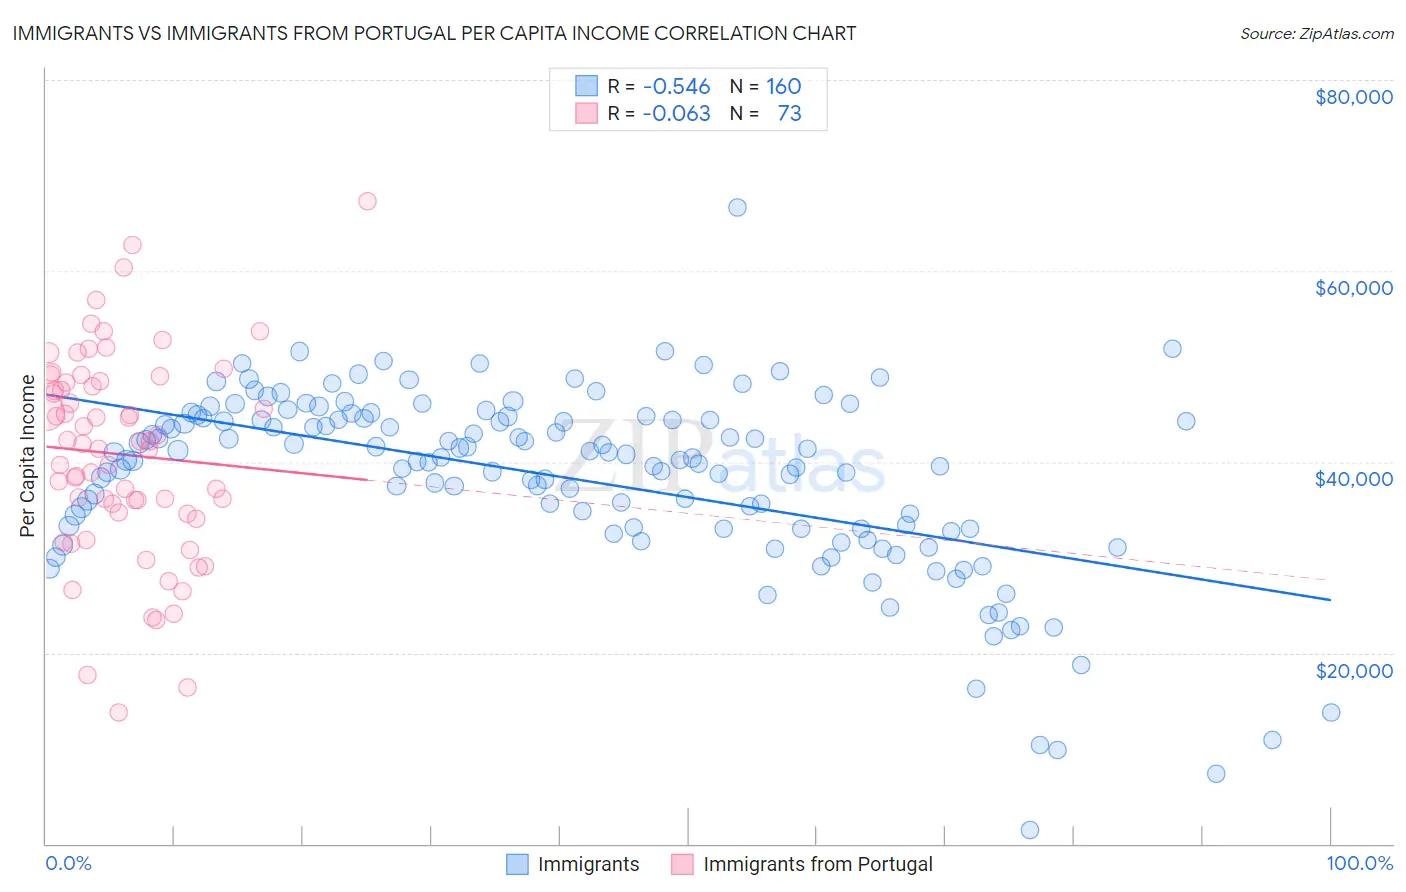
Immigrants vs Immigrants from Portugal Per Capita Income Correlation Chart
The statistical analysis conducted on geographies consisting of 577,833,144 people shows a substantial negative correlation between the proportion of Immigrants and per capita income in the United States with a correlation coefficient (R) of -0.546 and weighted average of $43,010. Similarly, the statistical analysis conducted on geographies consisting of 174,792,548 people shows a slight negative correlation between the proportion of Immigrants from Portugal and per capita income in the United States with a correlation coefficient (R) of -0.063 and weighted average of $42,412, a difference of 1.4%.
Per Capita Income Correlation Summary
| Measurement | Immigrants | Immigrants from Portugal |
| Minimum | $1,397 | $13,756 |
| Maximum | $66,654 | $67,338 |
| Range | $65,257 | $53,582 |
| Mean | $38,278 | $40,766 |
| Median | $40,300 | $41,948 |
| Interquartile 25% (IQ1) | $33,050 | $34,644 |
| Interquartile 75% (IQ3) | $44,506 | $48,401 |
| Interquartile Range (IQR) | $11,456 | $13,757 |
| Standard Deviation (Sample) | $9,625 | $10,670 |
| Standard Deviation (Population) | $9,595 | $10,597 |
Demographics Similar to Immigrants and Immigrants from Portugal by Per Capita Income
In terms of per capita income, the demographic groups most similar to Immigrants are French Canadian ($43,003, a difference of 0.020%), Spaniard ($43,028, a difference of 0.040%), Immigrants from Colombia ($42,971, a difference of 0.090%), German ($43,067, a difference of 0.13%), and Immigrants from Africa ($42,950, a difference of 0.14%). Similarly, the demographic groups most similar to Immigrants from Portugal are Barbadian ($42,406, a difference of 0.010%), Vietnamese ($42,368, a difference of 0.10%), Immigrants from Thailand ($42,289, a difference of 0.29%), Scotch-Irish ($42,563, a difference of 0.36%), and Dutch ($42,605, a difference of 0.46%).
| Demographics | Rating | Rank | Per Capita Income |
| Welsh | 38.2 /100 | #181 | Fair $43,233 |
| Immigrants | Vietnam | 38.1 /100 | #182 | Fair $43,229 |
| Germans | 33.9 /100 | #183 | Fair $43,067 |
| Spaniards | 32.9 /100 | #184 | Fair $43,028 |
| Immigrants | Immigrants | 32.5 /100 | #185 | Fair $43,010 |
| French Canadians | 32.3 /100 | #186 | Fair $43,003 |
| Immigrants | Colombia | 31.5 /100 | #187 | Fair $42,971 |
| Immigrants | Africa | 31.0 /100 | #188 | Fair $42,950 |
| Bermudans | 30.1 /100 | #189 | Fair $42,911 |
| Kenyans | 27.7 /100 | #190 | Fair $42,808 |
| Yugoslavians | 27.4 /100 | #191 | Fair $42,792 |
| Iraqis | 26.7 /100 | #192 | Fair $42,760 |
| Immigrants | Sierra Leone | 26.5 /100 | #193 | Fair $42,752 |
| Immigrants | Fiji | 25.2 /100 | #194 | Fair $42,694 |
| Immigrants | Kenya | 24.5 /100 | #195 | Fair $42,661 |
| Dutch | 23.4 /100 | #196 | Fair $42,605 |
| Scotch-Irish | 22.6 /100 | #197 | Fair $42,563 |
| Immigrants | Portugal | 19.7 /100 | #198 | Poor $42,412 |
| Barbadians | 19.6 /100 | #199 | Poor $42,406 |
| Vietnamese | 19.0 /100 | #200 | Poor $42,368 |
| Immigrants | Thailand | 17.6 /100 | #201 | Poor $42,289 |