Afghan vs Immigrants from Portugal Median Family Income
COMPARE
Afghan
Immigrants from Portugal
Median Family Income
Median Family Income Comparison
Afghans
Immigrants from Portugal
$112,971
MEDIAN FAMILY INCOME
99.5/ 100
METRIC RATING
72nd/ 347
METRIC RANK
$100,984
MEDIAN FAMILY INCOME
29.6/ 100
METRIC RATING
189th/ 347
METRIC RANK
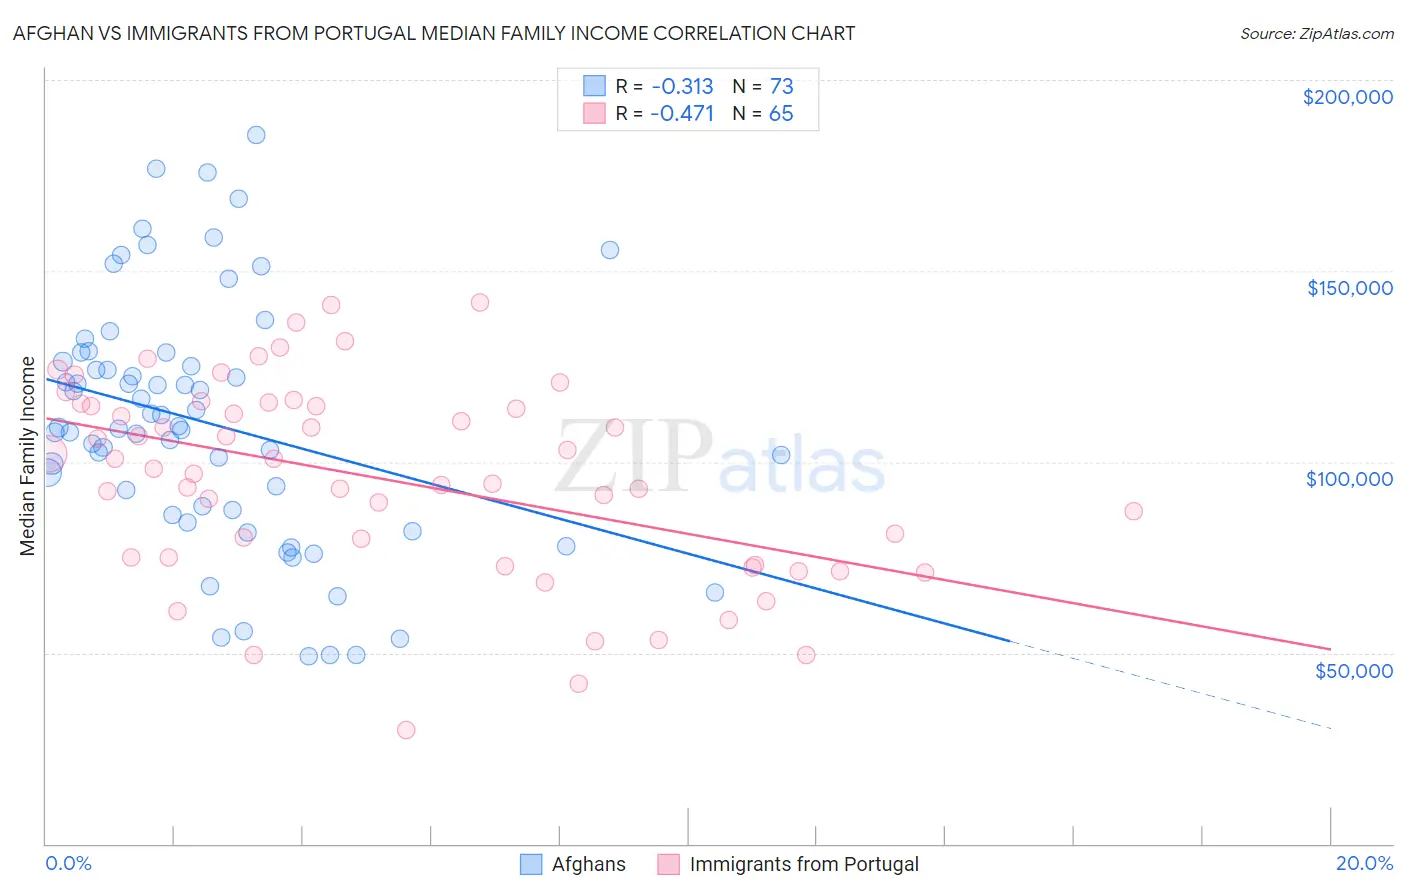
Afghan vs Immigrants from Portugal Median Family Income Correlation Chart
The statistical analysis conducted on geographies consisting of 148,816,167 people shows a mild negative correlation between the proportion of Afghans and median family income in the United States with a correlation coefficient (R) of -0.313 and weighted average of $112,971. Similarly, the statistical analysis conducted on geographies consisting of 174,753,640 people shows a moderate negative correlation between the proportion of Immigrants from Portugal and median family income in the United States with a correlation coefficient (R) of -0.471 and weighted average of $100,984, a difference of 11.9%.
Median Family Income Correlation Summary
| Measurement | Afghan | Immigrants from Portugal |
| Minimum | $49,167 | $29,911 |
| Maximum | $185,438 | $141,703 |
| Range | $136,271 | $111,792 |
| Mean | $110,128 | $95,434 |
| Median | $108,924 | $98,112 |
| Interquartile 25% (IQ1) | $86,729 | $73,840 |
| Interquartile 75% (IQ3) | $127,419 | $114,950 |
| Interquartile Range (IQR) | $40,689 | $41,110 |
| Standard Deviation (Sample) | $32,416 | $25,863 |
| Standard Deviation (Population) | $32,193 | $25,663 |
Similar Demographics by Median Family Income
Demographics Similar to Afghans by Median Family Income
In terms of median family income, the demographic groups most similar to Afghans are Laotian ($112,859, a difference of 0.10%), Immigrants from Italy ($112,848, a difference of 0.11%), South African ($113,229, a difference of 0.23%), Immigrants from Western Europe ($112,688, a difference of 0.25%), and Argentinean ($112,665, a difference of 0.27%).
| Demographics | Rating | Rank | Median Family Income |
| Egyptians | 99.7 /100 | #65 | Exceptional $114,119 |
| Paraguayans | 99.7 /100 | #66 | Exceptional $114,016 |
| Immigrants | Spain | 99.7 /100 | #67 | Exceptional $113,815 |
| Immigrants | Serbia | 99.6 /100 | #68 | Exceptional $113,463 |
| Immigrants | Bulgaria | 99.6 /100 | #69 | Exceptional $113,461 |
| Immigrants | Romania | 99.6 /100 | #70 | Exceptional $113,434 |
| South Africans | 99.5 /100 | #71 | Exceptional $113,229 |
| Afghans | 99.5 /100 | #72 | Exceptional $112,971 |
| Laotians | 99.5 /100 | #73 | Exceptional $112,859 |
| Immigrants | Italy | 99.4 /100 | #74 | Exceptional $112,848 |
| Immigrants | Western Europe | 99.4 /100 | #75 | Exceptional $112,688 |
| Argentineans | 99.4 /100 | #76 | Exceptional $112,665 |
| Immigrants | Eastern Europe | 99.4 /100 | #77 | Exceptional $112,527 |
| Immigrants | Canada | 99.3 /100 | #78 | Exceptional $112,374 |
| Italians | 99.3 /100 | #79 | Exceptional $112,372 |
Demographics Similar to Immigrants from Portugal by Median Family Income
In terms of median family income, the demographic groups most similar to Immigrants from Portugal are Immigrants ($100,962, a difference of 0.020%), Guamanian/Chamorro ($101,061, a difference of 0.080%), Tlingit-Haida ($101,092, a difference of 0.11%), Celtic ($101,139, a difference of 0.15%), and Dutch ($101,192, a difference of 0.21%).
| Demographics | Rating | Rank | Median Family Income |
| Tsimshian | 35.9 /100 | #182 | Fair $101,543 |
| Kenyans | 34.5 /100 | #183 | Fair $101,417 |
| Immigrants | Costa Rica | 33.7 /100 | #184 | Fair $101,354 |
| Dutch | 31.9 /100 | #185 | Fair $101,192 |
| Celtics | 31.3 /100 | #186 | Fair $101,139 |
| Tlingit-Haida | 30.8 /100 | #187 | Fair $101,092 |
| Guamanians/Chamorros | 30.5 /100 | #188 | Fair $101,061 |
| Immigrants | Portugal | 29.6 /100 | #189 | Fair $100,984 |
| Immigrants | Immigrants | 29.4 /100 | #190 | Fair $100,962 |
| Colombians | 27.2 /100 | #191 | Fair $100,750 |
| Immigrants | Kenya | 26.5 /100 | #192 | Fair $100,679 |
| Iraqis | 26.3 /100 | #193 | Fair $100,658 |
| Uruguayans | 26.3 /100 | #194 | Fair $100,656 |
| Immigrants | South America | 23.9 /100 | #195 | Fair $100,414 |
| Samoans | 23.3 /100 | #196 | Fair $100,344 |