Immigrants from West Indies vs Immigrants from France Per Capita Income
COMPARE
Immigrants from West Indies
Immigrants from France
Per Capita Income
Per Capita Income Comparison
Immigrants from West Indies
Immigrants from France
$40,763
PER CAPITA INCOME
3.7/ 100
METRIC RATING
234th/ 347
METRIC RANK
$54,557
PER CAPITA INCOME
100.0/ 100
METRIC RATING
17th/ 347
METRIC RANK
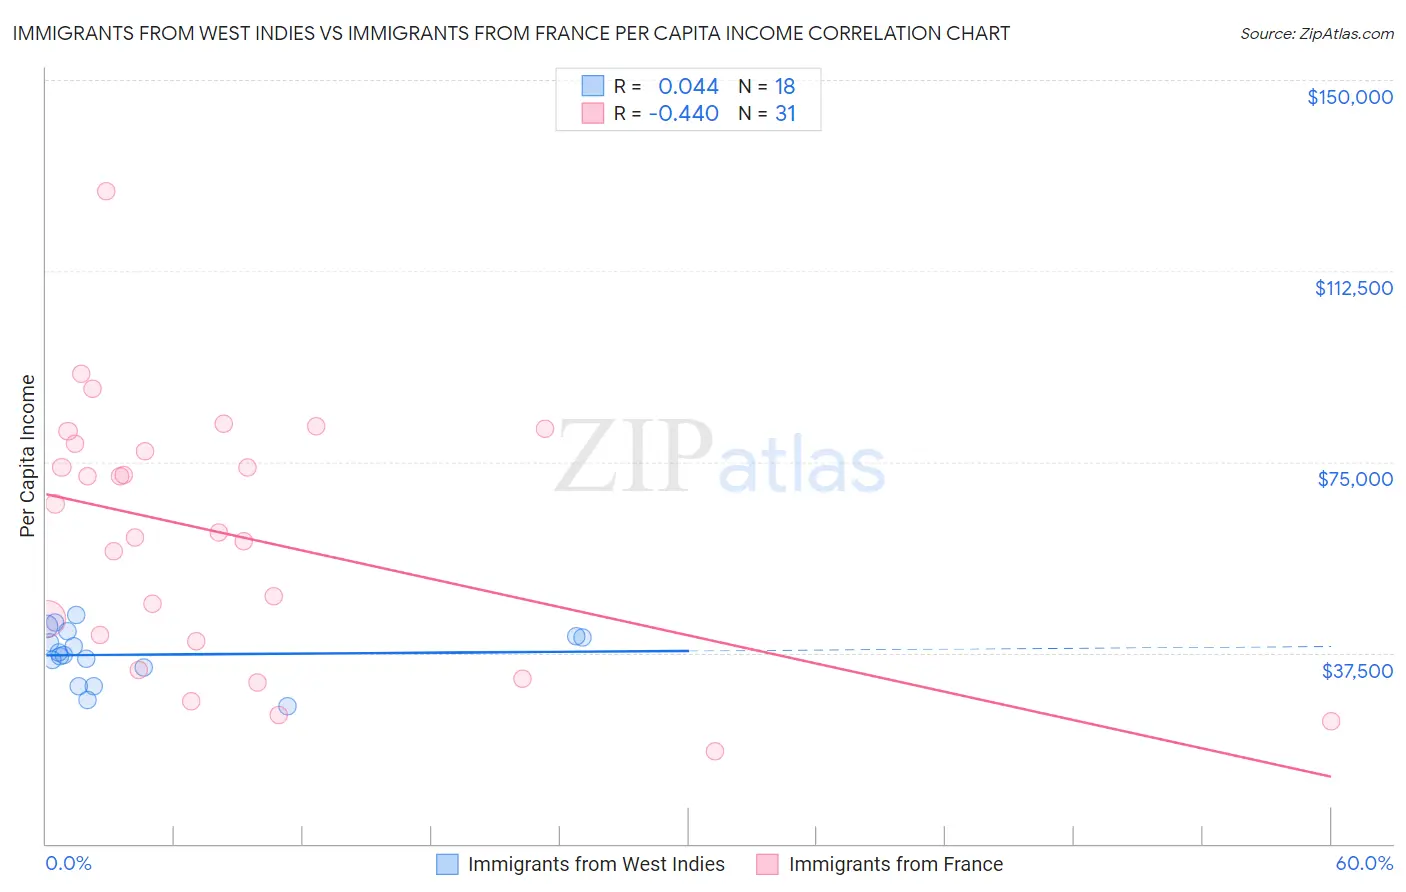
Immigrants from West Indies vs Immigrants from France Per Capita Income Correlation Chart
The statistical analysis conducted on geographies consisting of 72,420,477 people shows no correlation between the proportion of Immigrants from West Indies and per capita income in the United States with a correlation coefficient (R) of 0.044 and weighted average of $40,763. Similarly, the statistical analysis conducted on geographies consisting of 287,921,754 people shows a moderate negative correlation between the proportion of Immigrants from France and per capita income in the United States with a correlation coefficient (R) of -0.440 and weighted average of $54,557, a difference of 33.8%.
Per Capita Income Correlation Summary
| Measurement | Immigrants from West Indies | Immigrants from France |
| Minimum | $26,894 | $18,269 |
| Maximum | $45,008 | $128,207 |
| Range | $18,114 | $109,938 |
| Mean | $37,133 | $60,537 |
| Median | $37,421 | $61,063 |
| Interquartile 25% (IQ1) | $34,659 | $39,770 |
| Interquartile 75% (IQ3) | $40,860 | $78,483 |
| Interquartile Range (IQR) | $6,201 | $38,713 |
| Standard Deviation (Sample) | $5,188 | $25,024 |
| Standard Deviation (Population) | $5,042 | $24,617 |
Similar Demographics by Per Capita Income
Demographics Similar to Immigrants from West Indies by Per Capita Income
In terms of per capita income, the demographic groups most similar to Immigrants from West Indies are Delaware ($40,778, a difference of 0.040%), Immigrants from Guyana ($40,742, a difference of 0.050%), Nonimmigrants ($40,669, a difference of 0.23%), Guyanese ($40,949, a difference of 0.46%), and Senegalese ($41,000, a difference of 0.58%).
| Demographics | Rating | Rank | Per Capita Income |
| Immigrants | Ghana | 5.5 /100 | #227 | Tragic $41,131 |
| Immigrants | Grenada | 5.5 /100 | #228 | Tragic $41,123 |
| Nigerians | 4.9 /100 | #229 | Tragic $41,026 |
| Native Hawaiians | 4.9 /100 | #230 | Tragic $41,017 |
| Senegalese | 4.8 /100 | #231 | Tragic $41,000 |
| Guyanese | 4.5 /100 | #232 | Tragic $40,949 |
| Delaware | 3.8 /100 | #233 | Tragic $40,778 |
| Immigrants | West Indies | 3.7 /100 | #234 | Tragic $40,763 |
| Immigrants | Guyana | 3.6 /100 | #235 | Tragic $40,742 |
| Immigrants | Nonimmigrants | 3.4 /100 | #236 | Tragic $40,669 |
| Immigrants | Cambodia | 2.6 /100 | #237 | Tragic $40,434 |
| Somalis | 2.4 /100 | #238 | Tragic $40,367 |
| Tsimshian | 2.4 /100 | #239 | Tragic $40,344 |
| Immigrants | Nigeria | 2.3 /100 | #240 | Tragic $40,339 |
| British West Indians | 2.3 /100 | #241 | Tragic $40,330 |
Demographics Similar to Immigrants from France by Per Capita Income
In terms of per capita income, the demographic groups most similar to Immigrants from France are Thai ($54,307, a difference of 0.46%), Immigrants from China ($54,264, a difference of 0.54%), Immigrants from Switzerland ($54,866, a difference of 0.57%), Cypriot ($54,899, a difference of 0.63%), and Soviet Union ($54,202, a difference of 0.65%).
| Demographics | Rating | Rank | Per Capita Income |
| Okinawans | 100.0 /100 | #10 | Exceptional $55,817 |
| Eastern Europeans | 100.0 /100 | #11 | Exceptional $55,780 |
| Immigrants | Sweden | 100.0 /100 | #12 | Exceptional $55,582 |
| Immigrants | India | 100.0 /100 | #13 | Exceptional $55,268 |
| Immigrants | Belgium | 100.0 /100 | #14 | Exceptional $55,082 |
| Cypriots | 100.0 /100 | #15 | Exceptional $54,899 |
| Immigrants | Switzerland | 100.0 /100 | #16 | Exceptional $54,866 |
| Immigrants | France | 100.0 /100 | #17 | Exceptional $54,557 |
| Thais | 100.0 /100 | #18 | Exceptional $54,307 |
| Immigrants | China | 100.0 /100 | #19 | Exceptional $54,264 |
| Soviet Union | 100.0 /100 | #20 | Exceptional $54,202 |
| Immigrants | Northern Europe | 100.0 /100 | #21 | Exceptional $54,159 |
| Indians (Asian) | 100.0 /100 | #22 | Exceptional $53,874 |
| Immigrants | Eastern Asia | 100.0 /100 | #23 | Exceptional $53,806 |
| Immigrants | Denmark | 100.0 /100 | #24 | Exceptional $53,799 |