Immigrants from Trinidad and Tobago vs South American Indian Hearing Disability
COMPARE
Immigrants from Trinidad and Tobago
South American Indian
Hearing Disability
Hearing Disability Comparison
Immigrants from Trinidad and Tobago
South American Indians
2.5%
HEARING DISABILITY
99.9/ 100
METRIC RATING
11th/ 347
METRIC RANK
2.9%
HEARING DISABILITY
86.9/ 100
METRIC RATING
127th/ 347
METRIC RANK
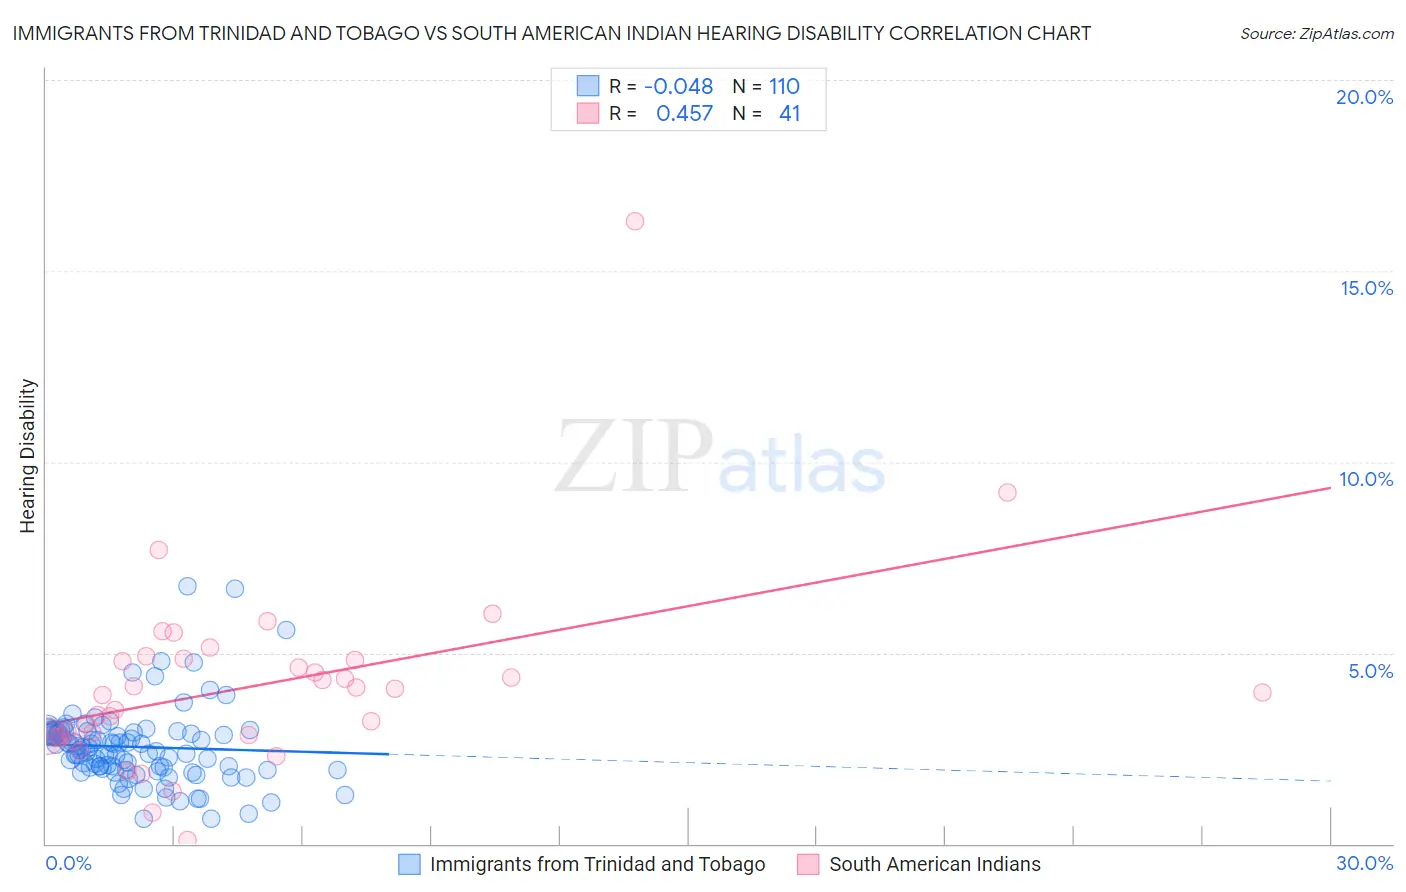
Immigrants from Trinidad and Tobago vs South American Indian Hearing Disability Correlation Chart
The statistical analysis conducted on geographies consisting of 223,480,076 people shows no correlation between the proportion of Immigrants from Trinidad and Tobago and percentage of population with hearing disability in the United States with a correlation coefficient (R) of -0.048 and weighted average of 2.5%. Similarly, the statistical analysis conducted on geographies consisting of 164,558,216 people shows a moderate positive correlation between the proportion of South American Indians and percentage of population with hearing disability in the United States with a correlation coefficient (R) of 0.457 and weighted average of 2.9%, a difference of 15.0%.
Hearing Disability Correlation Summary
| Measurement | Immigrants from Trinidad and Tobago | South American Indian |
| Minimum | 0.64% | 0.098% |
| Maximum | 6.8% | 16.3% |
| Range | 6.1% | 16.2% |
| Mean | 2.5% | 4.1% |
| Median | 2.5% | 4.0% |
| Interquartile 25% (IQ1) | 2.0% | 2.8% |
| Interquartile 75% (IQ3) | 2.9% | 4.8% |
| Interquartile Range (IQR) | 0.93% | 2.0% |
| Standard Deviation (Sample) | 1.0% | 2.6% |
| Standard Deviation (Population) | 1.0% | 2.6% |
Similar Demographics by Hearing Disability
Demographics Similar to Immigrants from Trinidad and Tobago by Hearing Disability
In terms of hearing disability, the demographic groups most similar to Immigrants from Trinidad and Tobago are Trinidadian and Tobagonian (2.5%, a difference of 0.30%), Sierra Leonean (2.5%, a difference of 0.53%), Immigrants from Ecuador (2.5%, a difference of 0.55%), Ecuadorian (2.5%, a difference of 0.85%), and Barbadian (2.5%, a difference of 1.1%).
| Demographics | Rating | Rank | Hearing Disability |
| Immigrants | Guyana | 100.0 /100 | #4 | Exceptional 2.3% |
| Immigrants | Barbados | 100.0 /100 | #5 | Exceptional 2.4% |
| Vietnamese | 100.0 /100 | #6 | Exceptional 2.4% |
| Immigrants | Bangladesh | 100.0 /100 | #7 | Exceptional 2.4% |
| British West Indians | 100.0 /100 | #8 | Exceptional 2.4% |
| Immigrants | Dominican Republic | 100.0 /100 | #9 | Exceptional 2.4% |
| Immigrants | Ecuador | 99.9 /100 | #10 | Exceptional 2.5% |
| Immigrants | Trinidad and Tobago | 99.9 /100 | #11 | Exceptional 2.5% |
| Trinidadians and Tobagonians | 99.9 /100 | #12 | Exceptional 2.5% |
| Sierra Leoneans | 99.9 /100 | #13 | Exceptional 2.5% |
| Ecuadorians | 99.9 /100 | #14 | Exceptional 2.5% |
| Barbadians | 99.9 /100 | #15 | Exceptional 2.5% |
| Immigrants | West Indies | 99.9 /100 | #16 | Exceptional 2.5% |
| Immigrants | India | 99.9 /100 | #17 | Exceptional 2.5% |
| Dominicans | 99.8 /100 | #18 | Exceptional 2.5% |
Demographics Similar to South American Indians by Hearing Disability
In terms of hearing disability, the demographic groups most similar to South American Indians are Immigrants from Western Asia (2.9%, a difference of 0.0%), Immigrants from Uganda (2.9%, a difference of 0.050%), Immigrants from Vietnam (2.9%, a difference of 0.070%), Immigrants from Kenya (2.9%, a difference of 0.16%), and Chilean (2.9%, a difference of 0.21%).
| Demographics | Rating | Rank | Hearing Disability |
| Jordanians | 89.5 /100 | #120 | Excellent 2.8% |
| Cubans | 89.4 /100 | #121 | Excellent 2.8% |
| Liberians | 89.0 /100 | #122 | Excellent 2.8% |
| Immigrants | Zaire | 88.6 /100 | #123 | Excellent 2.9% |
| Bahamians | 88.6 /100 | #124 | Excellent 2.9% |
| Immigrants | Albania | 88.5 /100 | #125 | Excellent 2.9% |
| Immigrants | Sudan | 87.8 /100 | #126 | Excellent 2.9% |
| South American Indians | 86.9 /100 | #127 | Excellent 2.9% |
| Immigrants | Western Asia | 86.9 /100 | #128 | Excellent 2.9% |
| Immigrants | Uganda | 86.6 /100 | #129 | Excellent 2.9% |
| Immigrants | Vietnam | 86.5 /100 | #130 | Excellent 2.9% |
| Immigrants | Kenya | 86.1 /100 | #131 | Excellent 2.9% |
| Chileans | 85.8 /100 | #132 | Excellent 2.9% |
| Immigrants | Syria | 85.8 /100 | #133 | Excellent 2.9% |
| Ugandans | 85.5 /100 | #134 | Excellent 2.9% |