Immigrants from Thailand vs Filipino Median Earnings
COMPARE
Immigrants from Thailand
Filipino
Median Earnings
Median Earnings Comparison
Immigrants from Thailand
Filipinos
$45,598
MEDIAN EARNINGS
23.7/ 100
METRIC RATING
209th/ 347
METRIC RANK
$61,197
MEDIAN EARNINGS
100.0/ 100
METRIC RATING
1st/ 347
METRIC RANK
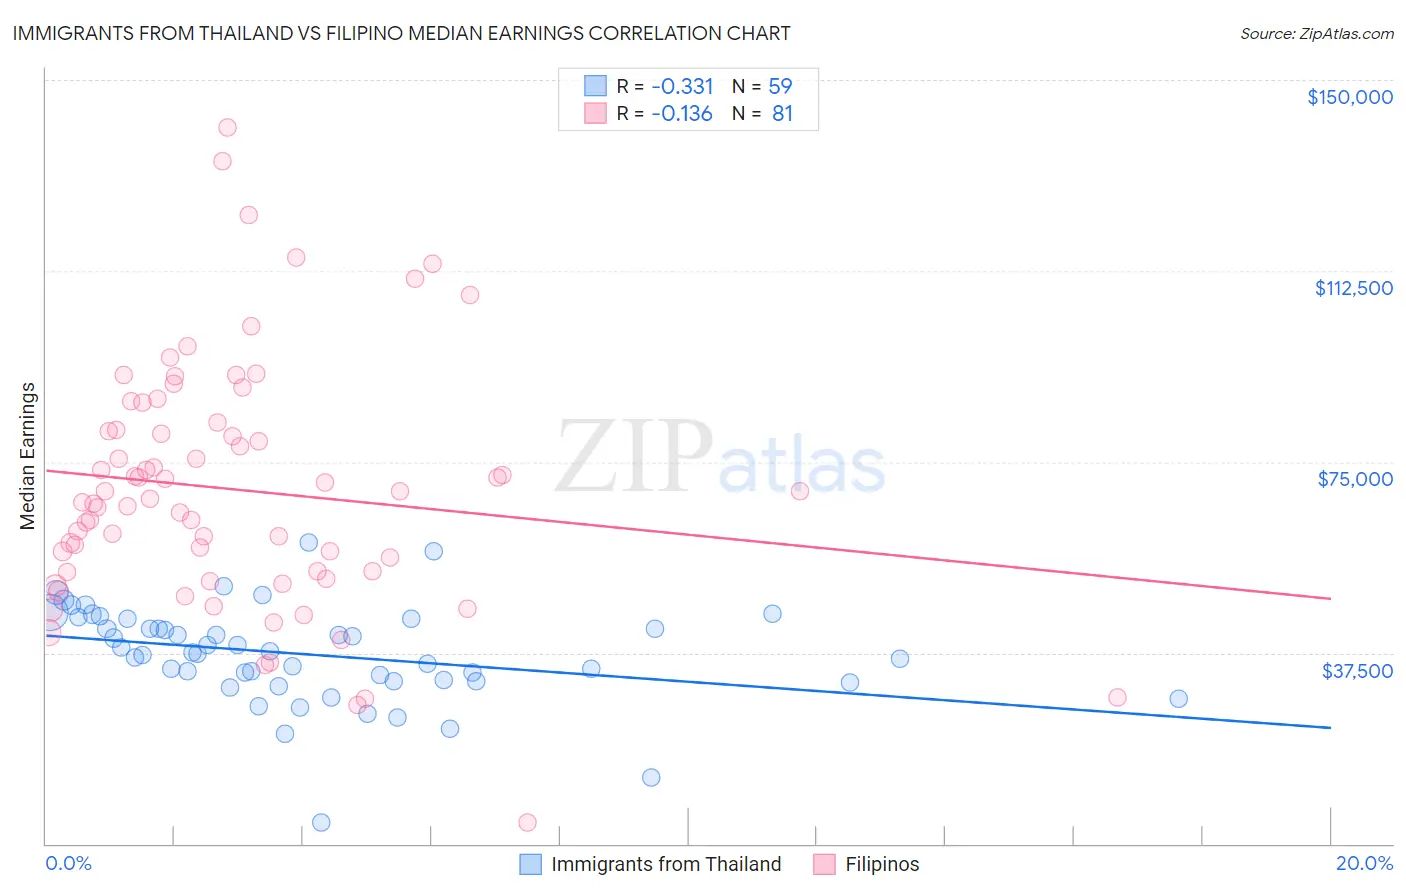
Immigrants from Thailand vs Filipino Median Earnings Correlation Chart
The statistical analysis conducted on geographies consisting of 316,998,923 people shows a mild negative correlation between the proportion of Immigrants from Thailand and median earnings in the United States with a correlation coefficient (R) of -0.331 and weighted average of $45,598. Similarly, the statistical analysis conducted on geographies consisting of 254,346,955 people shows a poor negative correlation between the proportion of Filipinos and median earnings in the United States with a correlation coefficient (R) of -0.136 and weighted average of $61,197, a difference of 34.2%.
Median Earnings Correlation Summary
| Measurement | Immigrants from Thailand | Filipino |
| Minimum | $4,250 | $4,235 |
| Maximum | $59,094 | $140,756 |
| Range | $54,844 | $136,521 |
| Mean | $37,184 | $69,566 |
| Median | $37,501 | $67,852 |
| Interquartile 25% (IQ1) | $31,980 | $53,487 |
| Interquartile 75% (IQ3) | $44,250 | $81,976 |
| Interquartile Range (IQR) | $12,270 | $28,490 |
| Standard Deviation (Sample) | $9,579 | $24,296 |
| Standard Deviation (Population) | $9,498 | $24,146 |
Similar Demographics by Median Earnings
Demographics Similar to Immigrants from Thailand by Median Earnings
In terms of median earnings, the demographic groups most similar to Immigrants from Thailand are Immigrants from Bosnia and Herzegovina ($45,600, a difference of 0.0%), Immigrants from Grenada ($45,596, a difference of 0.0%), Panamanian ($45,593, a difference of 0.010%), Bermudan ($45,593, a difference of 0.010%), and Immigrants from Senegal ($45,611, a difference of 0.030%).
| Demographics | Rating | Rank | Median Earnings |
| Immigrants | Trinidad and Tobago | 27.1 /100 | #202 | Fair $45,729 |
| Welsh | 26.6 /100 | #203 | Fair $45,710 |
| Immigrants | Uruguay | 25.9 /100 | #204 | Fair $45,682 |
| Tongans | 25.4 /100 | #205 | Fair $45,665 |
| Immigrants | Ghana | 24.8 /100 | #206 | Fair $45,641 |
| Immigrants | Senegal | 24.0 /100 | #207 | Fair $45,611 |
| Immigrants | Bosnia and Herzegovina | 23.7 /100 | #208 | Fair $45,600 |
| Immigrants | Thailand | 23.7 /100 | #209 | Fair $45,598 |
| Immigrants | Grenada | 23.6 /100 | #210 | Fair $45,596 |
| Panamanians | 23.5 /100 | #211 | Fair $45,593 |
| Bermudans | 23.5 /100 | #212 | Fair $45,593 |
| Immigrants | Colombia | 22.4 /100 | #213 | Fair $45,550 |
| Nigerians | 22.0 /100 | #214 | Fair $45,532 |
| Immigrants | Bangladesh | 22.0 /100 | #215 | Fair $45,532 |
| Guyanese | 20.6 /100 | #216 | Fair $45,470 |
Demographics Similar to Filipinos by Median Earnings
In terms of median earnings, the demographic groups most similar to Filipinos are Immigrants from Taiwan ($61,151, a difference of 0.080%), Immigrants from India ($60,648, a difference of 0.91%), Immigrants from Hong Kong ($59,433, a difference of 3.0%), Thai ($59,237, a difference of 3.3%), and Immigrants from Singapore ($59,038, a difference of 3.7%).
| Demographics | Rating | Rank | Median Earnings |
| Filipinos | 100.0 /100 | #1 | Exceptional $61,197 |
| Immigrants | Taiwan | 100.0 /100 | #2 | Exceptional $61,151 |
| Immigrants | India | 100.0 /100 | #3 | Exceptional $60,648 |
| Immigrants | Hong Kong | 100.0 /100 | #4 | Exceptional $59,433 |
| Thais | 100.0 /100 | #5 | Exceptional $59,237 |
| Immigrants | Singapore | 100.0 /100 | #6 | Exceptional $59,038 |
| Iranians | 100.0 /100 | #7 | Exceptional $58,474 |
| Immigrants | Iran | 100.0 /100 | #8 | Exceptional $57,612 |
| Okinawans | 100.0 /100 | #9 | Exceptional $57,550 |
| Immigrants | South Central Asia | 100.0 /100 | #10 | Exceptional $57,114 |
| Immigrants | Israel | 100.0 /100 | #11 | Exceptional $57,034 |
| Immigrants | Ireland | 100.0 /100 | #12 | Exceptional $56,854 |
| Immigrants | China | 100.0 /100 | #13 | Exceptional $56,638 |
| Immigrants | Australia | 100.0 /100 | #14 | Exceptional $56,305 |
| Indians (Asian) | 100.0 /100 | #15 | Exceptional $56,253 |