Immigrants from Thailand vs Delaware Median Earnings
COMPARE
Immigrants from Thailand
Delaware
Median Earnings
Median Earnings Comparison
Immigrants from Thailand
Delaware
$45,598
MEDIAN EARNINGS
23.7/ 100
METRIC RATING
209th/ 347
METRIC RANK
$44,783
MEDIAN EARNINGS
9.0/ 100
METRIC RATING
232nd/ 347
METRIC RANK
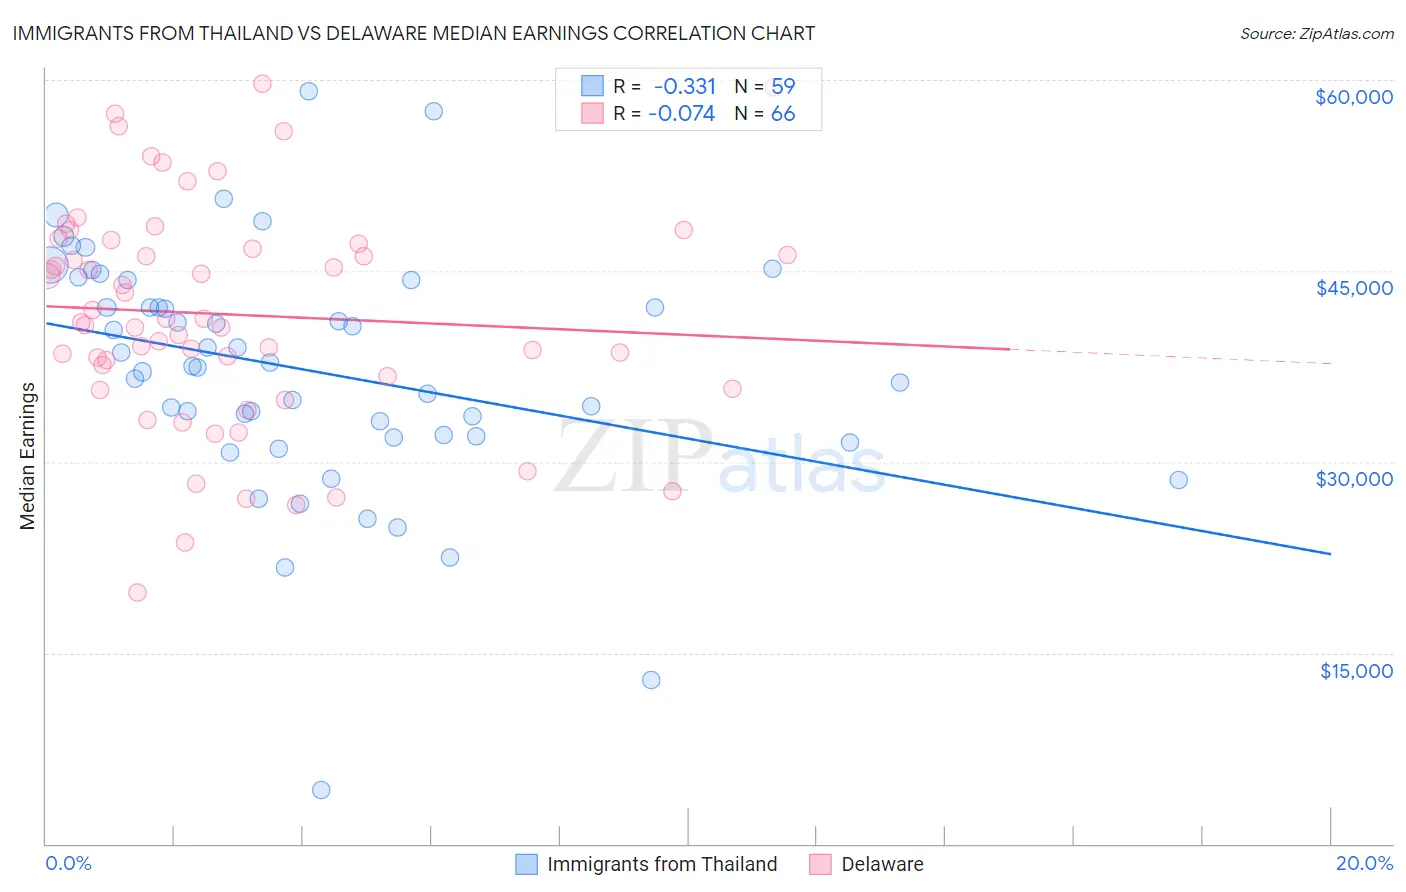
Immigrants from Thailand vs Delaware Median Earnings Correlation Chart
The statistical analysis conducted on geographies consisting of 316,998,923 people shows a mild negative correlation between the proportion of Immigrants from Thailand and median earnings in the United States with a correlation coefficient (R) of -0.331 and weighted average of $45,598. Similarly, the statistical analysis conducted on geographies consisting of 96,235,383 people shows a slight negative correlation between the proportion of Delaware and median earnings in the United States with a correlation coefficient (R) of -0.074 and weighted average of $44,783, a difference of 1.8%.
Median Earnings Correlation Summary
| Measurement | Immigrants from Thailand | Delaware |
| Minimum | $4,250 | $19,766 |
| Maximum | $59,094 | $59,711 |
| Range | $54,844 | $39,945 |
| Mean | $37,184 | $41,572 |
| Median | $37,501 | $41,074 |
| Interquartile 25% (IQ1) | $31,980 | $36,711 |
| Interquartile 75% (IQ3) | $44,250 | $47,149 |
| Interquartile Range (IQR) | $12,270 | $10,438 |
| Standard Deviation (Sample) | $9,579 | $8,740 |
| Standard Deviation (Population) | $9,498 | $8,674 |
Similar Demographics by Median Earnings
Demographics Similar to Immigrants from Thailand by Median Earnings
In terms of median earnings, the demographic groups most similar to Immigrants from Thailand are Immigrants from Bosnia and Herzegovina ($45,600, a difference of 0.0%), Immigrants from Grenada ($45,596, a difference of 0.0%), Panamanian ($45,593, a difference of 0.010%), Bermudan ($45,593, a difference of 0.010%), and Immigrants from Senegal ($45,611, a difference of 0.030%).
| Demographics | Rating | Rank | Median Earnings |
| Immigrants | Trinidad and Tobago | 27.1 /100 | #202 | Fair $45,729 |
| Welsh | 26.6 /100 | #203 | Fair $45,710 |
| Immigrants | Uruguay | 25.9 /100 | #204 | Fair $45,682 |
| Tongans | 25.4 /100 | #205 | Fair $45,665 |
| Immigrants | Ghana | 24.8 /100 | #206 | Fair $45,641 |
| Immigrants | Senegal | 24.0 /100 | #207 | Fair $45,611 |
| Immigrants | Bosnia and Herzegovina | 23.7 /100 | #208 | Fair $45,600 |
| Immigrants | Thailand | 23.7 /100 | #209 | Fair $45,598 |
| Immigrants | Grenada | 23.6 /100 | #210 | Fair $45,596 |
| Panamanians | 23.5 /100 | #211 | Fair $45,593 |
| Bermudans | 23.5 /100 | #212 | Fair $45,593 |
| Immigrants | Colombia | 22.4 /100 | #213 | Fair $45,550 |
| Nigerians | 22.0 /100 | #214 | Fair $45,532 |
| Immigrants | Bangladesh | 22.0 /100 | #215 | Fair $45,532 |
| Guyanese | 20.6 /100 | #216 | Fair $45,470 |
Demographics Similar to Delaware by Median Earnings
In terms of median earnings, the demographic groups most similar to Delaware are Immigrants from Sudan ($44,767, a difference of 0.040%), Japanese ($44,825, a difference of 0.090%), Immigrants from Western Africa ($44,893, a difference of 0.24%), Scotch-Irish ($44,924, a difference of 0.32%), and Cape Verdean ($44,640, a difference of 0.32%).
| Demographics | Rating | Rank | Median Earnings |
| Immigrants | Cambodia | 13.2 /100 | #225 | Poor $45,090 |
| Immigrants | Nigeria | 12.2 /100 | #226 | Poor $45,030 |
| Native Hawaiians | 12.2 /100 | #227 | Poor $45,027 |
| Immigrants | Iraq | 11.6 /100 | #228 | Poor $44,988 |
| Scotch-Irish | 10.7 /100 | #229 | Poor $44,924 |
| Immigrants | Western Africa | 10.3 /100 | #230 | Poor $44,893 |
| Japanese | 9.5 /100 | #231 | Tragic $44,825 |
| Delaware | 9.0 /100 | #232 | Tragic $44,783 |
| Immigrants | Sudan | 8.8 /100 | #233 | Tragic $44,767 |
| Cape Verdeans | 7.5 /100 | #234 | Tragic $44,640 |
| Venezuelans | 6.9 /100 | #235 | Tragic $44,580 |
| British West Indians | 6.7 /100 | #236 | Tragic $44,552 |
| Immigrants | Ecuador | 5.9 /100 | #237 | Tragic $44,462 |
| Sudanese | 5.6 /100 | #238 | Tragic $44,419 |
| Senegalese | 5.3 /100 | #239 | Tragic $44,373 |