Immigrants from Thailand vs Filipino Disability Age Over 75
COMPARE
Immigrants from Thailand
Filipino
Disability Age Over 75
Disability Age Over 75 Comparison
Immigrants from Thailand
Filipinos
48.3%
DISABILITY AGE OVER 75
2.8/ 100
METRIC RATING
239th/ 347
METRIC RANK
45.4%
DISABILITY AGE OVER 75
99.9/ 100
METRIC RATING
29th/ 347
METRIC RANK
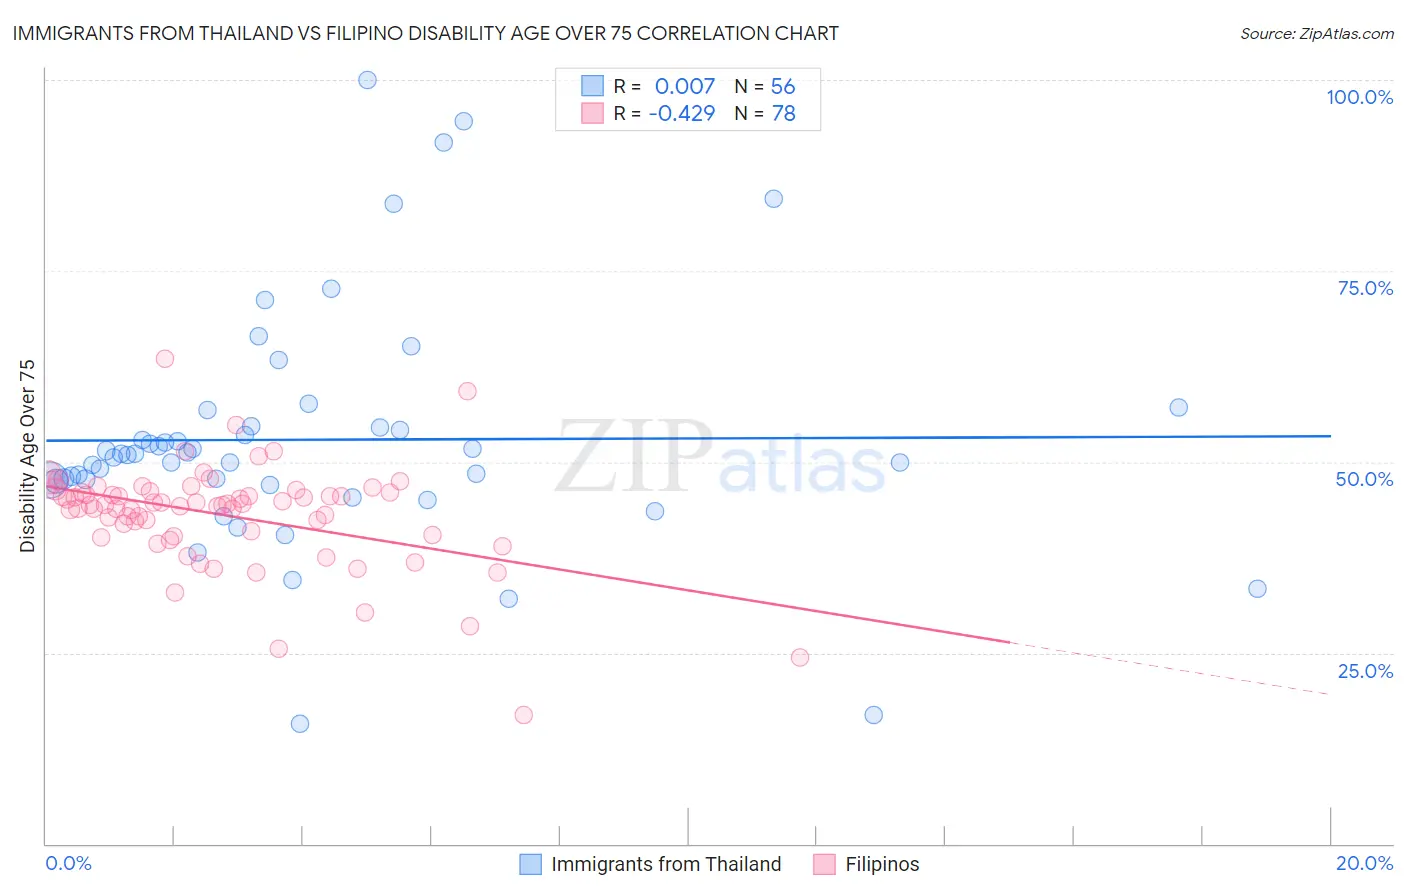
Immigrants from Thailand vs Filipino Disability Age Over 75 Correlation Chart
The statistical analysis conducted on geographies consisting of 316,651,831 people shows no correlation between the proportion of Immigrants from Thailand and percentage of population with a disability over the age of 75 in the United States with a correlation coefficient (R) of 0.007 and weighted average of 48.3%. Similarly, the statistical analysis conducted on geographies consisting of 253,957,149 people shows a moderate negative correlation between the proportion of Filipinos and percentage of population with a disability over the age of 75 in the United States with a correlation coefficient (R) of -0.429 and weighted average of 45.4%, a difference of 6.3%.
Disability Age Over 75 Correlation Summary
| Measurement | Immigrants from Thailand | Filipino |
| Minimum | 15.8% | 16.9% |
| Maximum | 100.0% | 63.6% |
| Range | 84.2% | 46.6% |
| Mean | 52.9% | 43.1% |
| Median | 51.0% | 44.4% |
| Interquartile 25% (IQ1) | 47.5% | 40.4% |
| Interquartile 75% (IQ3) | 54.6% | 45.9% |
| Interquartile Range (IQR) | 7.1% | 5.5% |
| Standard Deviation (Sample) | 15.7% | 6.8% |
| Standard Deviation (Population) | 15.6% | 6.8% |
Similar Demographics by Disability Age Over 75
Demographics Similar to Immigrants from Thailand by Disability Age Over 75
In terms of disability age over 75, the demographic groups most similar to Immigrants from Thailand are Nicaraguan (48.3%, a difference of 0.040%), Immigrants from Nicaragua (48.2%, a difference of 0.080%), Immigrants from St. Vincent and the Grenadines (48.2%, a difference of 0.080%), Tongan (48.3%, a difference of 0.11%), and Native Hawaiian (48.3%, a difference of 0.12%).
| Demographics | Rating | Rank | Disability Age Over 75 |
| Indonesians | 4.2 /100 | #232 | Tragic 48.2% |
| Cree | 4.2 /100 | #233 | Tragic 48.2% |
| Sub-Saharan Africans | 3.8 /100 | #234 | Tragic 48.2% |
| Hmong | 3.8 /100 | #235 | Tragic 48.2% |
| Immigrants | Nicaragua | 3.2 /100 | #236 | Tragic 48.2% |
| Immigrants | St. Vincent and the Grenadines | 3.2 /100 | #237 | Tragic 48.2% |
| Nicaraguans | 3.0 /100 | #238 | Tragic 48.3% |
| Immigrants | Thailand | 2.8 /100 | #239 | Tragic 48.3% |
| Tongans | 2.3 /100 | #240 | Tragic 48.3% |
| Native Hawaiians | 2.2 /100 | #241 | Tragic 48.3% |
| French American Indians | 2.2 /100 | #242 | Tragic 48.3% |
| Immigrants | Caribbean | 2.1 /100 | #243 | Tragic 48.4% |
| Afghans | 1.8 /100 | #244 | Tragic 48.4% |
| Americans | 1.7 /100 | #245 | Tragic 48.4% |
| Chippewa | 1.6 /100 | #246 | Tragic 48.4% |
Demographics Similar to Filipinos by Disability Age Over 75
In terms of disability age over 75, the demographic groups most similar to Filipinos are Immigrants from Denmark (45.4%, a difference of 0.030%), Thai (45.4%, a difference of 0.040%), Immigrants from Poland (45.4%, a difference of 0.060%), Macedonian (45.4%, a difference of 0.080%), and Immigrants from Bulgaria (45.5%, a difference of 0.090%).
| Demographics | Rating | Rank | Disability Age Over 75 |
| Immigrants | South Africa | 100.0 /100 | #22 | Exceptional 45.3% |
| Immigrants | Switzerland | 99.9 /100 | #23 | Exceptional 45.3% |
| Poles | 99.9 /100 | #24 | Exceptional 45.3% |
| Immigrants | Bolivia | 99.9 /100 | #25 | Exceptional 45.4% |
| Macedonians | 99.9 /100 | #26 | Exceptional 45.4% |
| Immigrants | Poland | 99.9 /100 | #27 | Exceptional 45.4% |
| Thais | 99.9 /100 | #28 | Exceptional 45.4% |
| Filipinos | 99.9 /100 | #29 | Exceptional 45.4% |
| Immigrants | Denmark | 99.9 /100 | #30 | Exceptional 45.4% |
| Immigrants | Bulgaria | 99.9 /100 | #31 | Exceptional 45.5% |
| Immigrants | Australia | 99.9 /100 | #32 | Exceptional 45.5% |
| Immigrants | Croatia | 99.9 /100 | #33 | Exceptional 45.5% |
| Russians | 99.9 /100 | #34 | Exceptional 45.5% |
| Norwegians | 99.9 /100 | #35 | Exceptional 45.5% |
| Immigrants | Taiwan | 99.9 /100 | #36 | Exceptional 45.5% |