Immigrants from Southern Europe vs Pueblo Householder Income Under 25 years
COMPARE
Immigrants from Southern Europe
Pueblo
Householder Income Under 25 years
Householder Income Under 25 years Comparison
Immigrants from Southern Europe
Pueblo
$54,484
HOUSEHOLDER INCOME UNDER 25 YEARS
99.6/ 100
METRIC RATING
77th/ 347
METRIC RANK
$45,018
HOUSEHOLDER INCOME UNDER 25 YEARS
0.0/ 100
METRIC RATING
337th/ 347
METRIC RANK
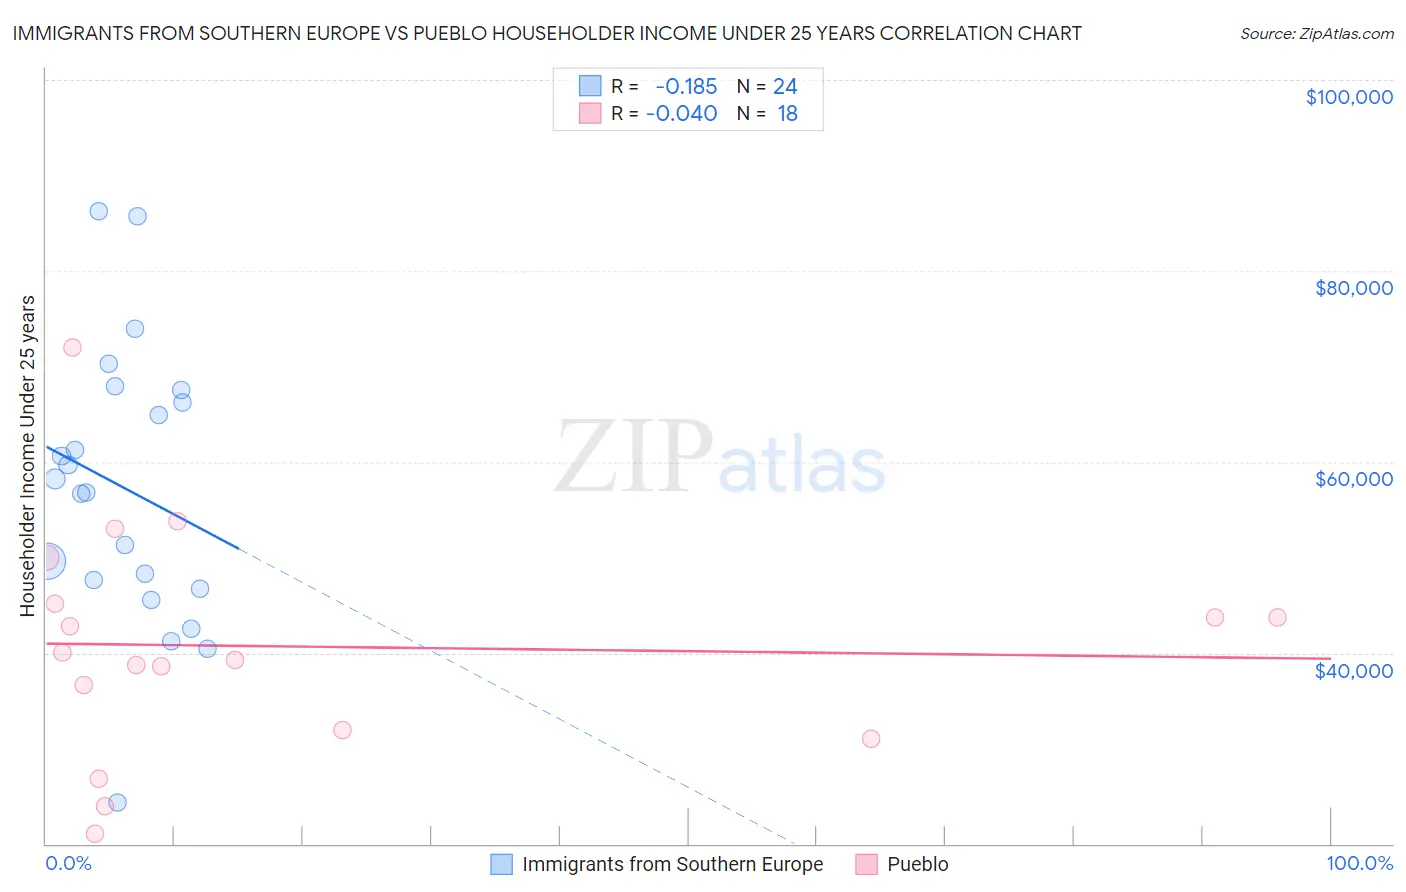
Immigrants from Southern Europe vs Pueblo Householder Income Under 25 years Correlation Chart
The statistical analysis conducted on geographies consisting of 332,779,485 people shows a poor negative correlation between the proportion of Immigrants from Southern Europe and household income with householder under the age of 25 in the United States with a correlation coefficient (R) of -0.185 and weighted average of $54,484. Similarly, the statistical analysis conducted on geographies consisting of 113,072,250 people shows no correlation between the proportion of Pueblo and household income with householder under the age of 25 in the United States with a correlation coefficient (R) of -0.040 and weighted average of $45,018, a difference of 21.0%.
Householder Income Under 25 years Correlation Summary
| Measurement | Immigrants from Southern Europe | Pueblo |
| Minimum | $24,293 | $21,071 |
| Maximum | $86,315 | $72,000 |
| Range | $62,022 | $50,929 |
| Mean | $57,230 | $40,668 |
| Median | $57,501 | $39,611 |
| Interquartile 25% (IQ1) | $47,158 | $31,875 |
| Interquartile 75% (IQ3) | $66,842 | $45,115 |
| Interquartile Range (IQR) | $19,684 | $13,240 |
| Standard Deviation (Sample) | $14,522 | $12,094 |
| Standard Deviation (Population) | $14,216 | $11,753 |
Similar Demographics by Householder Income Under 25 years
Demographics Similar to Immigrants from Southern Europe by Householder Income Under 25 years
In terms of householder income under 25 years, the demographic groups most similar to Immigrants from Southern Europe are Immigrants from Brazil ($54,487, a difference of 0.010%), Nepalese ($54,472, a difference of 0.020%), Immigrants from Sri Lanka ($54,512, a difference of 0.050%), Immigrants from Italy ($54,449, a difference of 0.060%), and Egyptian ($54,444, a difference of 0.070%).
| Demographics | Rating | Rank | Householder Income Under 25 years |
| Immigrants | El Salvador | 99.7 /100 | #70 | Exceptional $54,599 |
| Immigrants | Morocco | 99.7 /100 | #71 | Exceptional $54,593 |
| Immigrants | Northern Europe | 99.7 /100 | #72 | Exceptional $54,571 |
| Macedonians | 99.7 /100 | #73 | Exceptional $54,563 |
| Immigrants | Grenada | 99.7 /100 | #74 | Exceptional $54,538 |
| Immigrants | Sri Lanka | 99.7 /100 | #75 | Exceptional $54,512 |
| Immigrants | Brazil | 99.6 /100 | #76 | Exceptional $54,487 |
| Immigrants | Southern Europe | 99.6 /100 | #77 | Exceptional $54,484 |
| Nepalese | 99.6 /100 | #78 | Exceptional $54,472 |
| Immigrants | Italy | 99.6 /100 | #79 | Exceptional $54,449 |
| Egyptians | 99.6 /100 | #80 | Exceptional $54,444 |
| Portuguese | 99.6 /100 | #81 | Exceptional $54,436 |
| Russians | 99.5 /100 | #82 | Exceptional $54,389 |
| Laotians | 99.5 /100 | #83 | Exceptional $54,369 |
| Bulgarians | 99.5 /100 | #84 | Exceptional $54,352 |
Demographics Similar to Pueblo by Householder Income Under 25 years
In terms of householder income under 25 years, the demographic groups most similar to Pueblo are Tohono O'odham ($45,248, a difference of 0.51%), Cheyenne ($45,275, a difference of 0.57%), Chickasaw ($44,763, a difference of 0.57%), Kiowa ($44,733, a difference of 0.64%), and Cajun ($45,338, a difference of 0.71%).
| Demographics | Rating | Rank | Householder Income Under 25 years |
| Indonesians | 0.0 /100 | #330 | Tragic $45,566 |
| Immigrants | Zaire | 0.0 /100 | #331 | Tragic $45,529 |
| Choctaw | 0.0 /100 | #332 | Tragic $45,450 |
| Creek | 0.0 /100 | #333 | Tragic $45,371 |
| Cajuns | 0.0 /100 | #334 | Tragic $45,338 |
| Cheyenne | 0.0 /100 | #335 | Tragic $45,275 |
| Tohono O'odham | 0.0 /100 | #336 | Tragic $45,248 |
| Pueblo | 0.0 /100 | #337 | Tragic $45,018 |
| Chickasaw | 0.0 /100 | #338 | Tragic $44,763 |
| Kiowa | 0.0 /100 | #339 | Tragic $44,733 |
| Blacks/African Americans | 0.0 /100 | #340 | Tragic $44,381 |
| Houma | 0.0 /100 | #341 | Tragic $44,356 |
| Arapaho | 0.0 /100 | #342 | Tragic $44,003 |
| Immigrants | Yemen | 0.0 /100 | #343 | Tragic $43,591 |
| Immigrants | Congo | 0.0 /100 | #344 | Tragic $43,266 |