Immigrants from South Eastern Asia vs Immigrants from Spain Per Capita Income

COMPARE

Immigrants from South Eastern Asia
Race
Ancestry
AfghanAfricanAlaska NativeAlaskan AthabascanAlbanianAleutAlsatianAmericanApacheArabArapahoArgentineanArmenianAssyrian/Chaldean/SyriacAustralianAustrianBahamianBangladeshiBarbadianBasqueBelgianBelizeanBermudanBhutaneseBlackfeetBolivianBrazilianBritishBritish West IndianBulgarianBurmeseCajunCambodianCanadianCape VerdeanCarpatho RusynCelticCentral AmericanCentral American IndianCherokeeCheyenneChickasawChileanChineseChippewaChoctawColombianColvilleComancheCosta RicanCreeCreekCroatianCrowCubanCypriotCzechCzechoslovakianDanishDelawareDominicanDutchDutch West IndianEastern EuropeanEcuadorianEgyptianEnglishEstonianEthiopianEuropeanFijianFilipinoFinnishFrenchFrench American IndianFrench CanadianGermanGerman RussianGhanaianGreekGuamanian/ChamorroGuatemalanGuyaneseHaitianHmongHonduranHopiHoumaHungarianIcelanderIndian (Asian)IndonesianInupiatIranianIraqiIrishIroquoisIsraeliItalianJamaicanJapaneseJordanianKenyanKiowaKoreanLaotianLatvianLebaneseLiberianLithuanianLumbeeLuxembourgerMacedonianMalaysianMalteseMarshalleseMenomineeMexicanMexican American IndianMongolianMoroccanNative HawaiianNavajoNepaleseNew ZealanderNicaraguanNigerianNorthern EuropeanNorwegianOkinawanOsageOttawaPaiutePakistaniPalestinianPanamanianParaguayanPennsylvania GermanPeruvianPimaPolishPortuguesePotawatomiPuebloPuerto RicanPuget Sound SalishRomanianRussianSalvadoranSamoanScandinavianScotch-IrishScottishSeminoleSenegaleseSerbianShoshoneSierra LeoneanSiouxSlavicSlovakSloveneSomaliSouth AfricanSouth AmericanSouth American IndianSoviet UnionSpaniardSpanishSpanish AmericanSpanish American IndianSri LankanSubsaharan AfricanSudaneseSwedishSwissSyrianTaiwaneseThaiTlingit-HaidaTohono O'OdhamTonganTrinidadian and TobagonianTsimshianTurkishU.S. Virgin IslanderUgandanUkrainianUruguayanUteVenezuelanVietnameseWelshWest IndianYakamaYaquiYugoslavianYumanYup'ikZimbabwean
Immigration
NonimmigrantsImmigrantsAfghanistanAfricaAlbaniaArgentinaArmeniaAsiaAustraliaAustriaBahamasBangladeshBarbadosBelarusBelgiumBelizeBoliviaBosnia and HerzegovinaBrazilBulgariaBurma/MyanmarCabo VerdeCambodiaCameroonCanadaCaribbeanCentral AmericaChileChinaColombiaCongoCosta RicaCroatiaCubaCzechoslovakiaDenmarkDominicaDominican RepublicEastern AfricaEastern AsiaEastern EuropeEcuadorEgyptEl SalvadorEnglandEritreaEthiopiaEuropeFijiFranceGermanyGhanaGreeceGrenadaGuatemalaGuyanaHaitiHondurasHong KongHungaryIndiaIndonesiaIranIraqIrelandIsraelItalyJamaicaJapanJordanKazakhstanKenyaKoreaKuwaitLaosLatin AmericaLatviaLebanonLiberiaLithuaniaMalaysiaMexicoMicronesiaMiddle AfricaMoldovaMoroccoNepalNetherlandsNicaraguaNigeriaNorth AmericaNorth MacedoniaNorthern AfricaNorthern EuropeNorwayOceaniaPakistanPanamaPeruPhilippinesPolandPortugalRomaniaRussiaSaudi ArabiaScotlandSenegalSerbiaSierra LeoneSingaporeSomaliaSouth AfricaSouth AmericaSouth Central AsiaSouth Eastern AsiaSouthern EuropeSri LankaSt. Vincent and the GrenadinesSudanSwedenSwitzerlandSyriaTaiwanThailandTrinidad and TobagoTurkeyUgandaUkraineUruguayUzbekistanVenezuelaVietnamWest IndiesWestern AfricaWestern AsiaWestern EuropeYemenZaireZimbabweAzores
Immigrants from Spain
Race
Ancestry
AfghanAfricanAlaska NativeAlaskan AthabascanAlbanianAleutAlsatianAmericanApacheArabArapahoArgentineanArmenianAssyrian/Chaldean/SyriacAustralianAustrianBahamianBangladeshiBarbadianBasqueBelgianBelizeanBermudanBhutaneseBlackfeetBolivianBrazilianBritishBritish West IndianBulgarianBurmeseCajunCambodianCanadianCape VerdeanCarpatho RusynCelticCentral AmericanCentral American IndianCherokeeCheyenneChickasawChileanChineseChippewaChoctawColombianColvilleComancheCosta RicanCreeCreekCroatianCrowCubanCypriotCzechCzechoslovakianDanishDelawareDominicanDutchDutch West IndianEastern EuropeanEcuadorianEgyptianEnglishEstonianEthiopianEuropeanFijianFilipinoFinnishFrenchFrench American IndianFrench CanadianGermanGerman RussianGhanaianGreekGuamanian/ChamorroGuatemalanGuyaneseHaitianHmongHonduranHopiHoumaHungarianIcelanderIndian (Asian)IndonesianInupiatIranianIraqiIrishIroquoisIsraeliItalianJamaicanJapaneseJordanianKenyanKiowaKoreanLaotianLatvianLebaneseLiberianLithuanianLumbeeLuxembourgerMacedonianMalaysianMalteseMarshalleseMenomineeMexicanMexican American IndianMongolianMoroccanNative HawaiianNavajoNepaleseNew ZealanderNicaraguanNigerianNorthern EuropeanNorwegianOkinawanOsageOttawaPaiutePakistaniPalestinianPanamanianParaguayanPennsylvania GermanPeruvianPimaPolishPortuguesePotawatomiPuebloPuerto RicanPuget Sound SalishRomanianRussianSalvadoranSamoanScandinavianScotch-IrishScottishSeminoleSenegaleseSerbianShoshoneSierra LeoneanSiouxSlavicSlovakSloveneSomaliSouth AfricanSouth AmericanSouth American IndianSoviet UnionSpaniardSpanishSpanish AmericanSpanish American IndianSri LankanSubsaharan AfricanSudaneseSwedishSwissSyrianTaiwaneseThaiTlingit-HaidaTohono O'OdhamTonganTrinidadian and TobagonianTsimshianTurkishU.S. Virgin IslanderUgandanUkrainianUruguayanUteVenezuelanVietnameseWelshWest IndianYakamaYaquiYugoslavianYumanYup'ikZimbabwean
Immigration
NonimmigrantsImmigrantsAfghanistanAfricaAlbaniaArgentinaArmeniaAsiaAustraliaAustriaBahamasBangladeshBarbadosBelarusBelgiumBelizeBoliviaBosnia and HerzegovinaBrazilBulgariaBurma/MyanmarCabo VerdeCambodiaCameroonCanadaCaribbeanCentral AmericaChileChinaColombiaCongoCosta RicaCroatiaCubaCzechoslovakiaDenmarkDominicaDominican RepublicEastern AfricaEastern AsiaEastern EuropeEcuadorEgyptEl SalvadorEnglandEritreaEthiopiaEuropeFijiFranceGermanyGhanaGreeceGrenadaGuatemalaGuyanaHaitiHondurasHong KongHungaryIndiaIndonesiaIranIraqIrelandIsraelItalyJamaicaJapanJordanKazakhstanKenyaKoreaKuwaitLaosLatin AmericaLatviaLebanonLiberiaLithuaniaMalaysiaMexicoMicronesiaMiddle AfricaMoldovaMoroccoNepalNetherlandsNicaraguaNigeriaNorth AmericaNorth MacedoniaNorthern AfricaNorthern EuropeNorwayOceaniaPakistanPanamaPeruPhilippinesPolandPortugalRomaniaRussiaSaudi ArabiaScotlandSenegalSerbiaSierra LeoneSingaporeSomaliaSouth AfricaSouth AmericaSouth Central AsiaSouthern EuropeSpainSri LankaSt. Vincent and the GrenadinesSudanSwedenSwitzerlandSyriaTaiwanThailandTrinidad and TobagoTurkeyUgandaUkraineUruguayUzbekistanVenezuelaVietnamWest IndiesWestern AfricaWestern AsiaWestern EuropeYemenZaireZimbabweAzores
Per Capita Income
Income
Poverty
Unemployment
Labor Participation
Family Structure
Vehicle Availability
Education Level
Disability

Per Capita Income Comparison

Immigrants from South Eastern Asia

Immigrants from Spain

Average
Exceptional
$43,539
PER CAPITA INCOME
46.6/ 100
METRIC RATING
176th/ 347
METRIC RANK
$50,933
PER CAPITA INCOME
100.0/ 100
METRIC RATING
45th/ 347
METRIC RANK

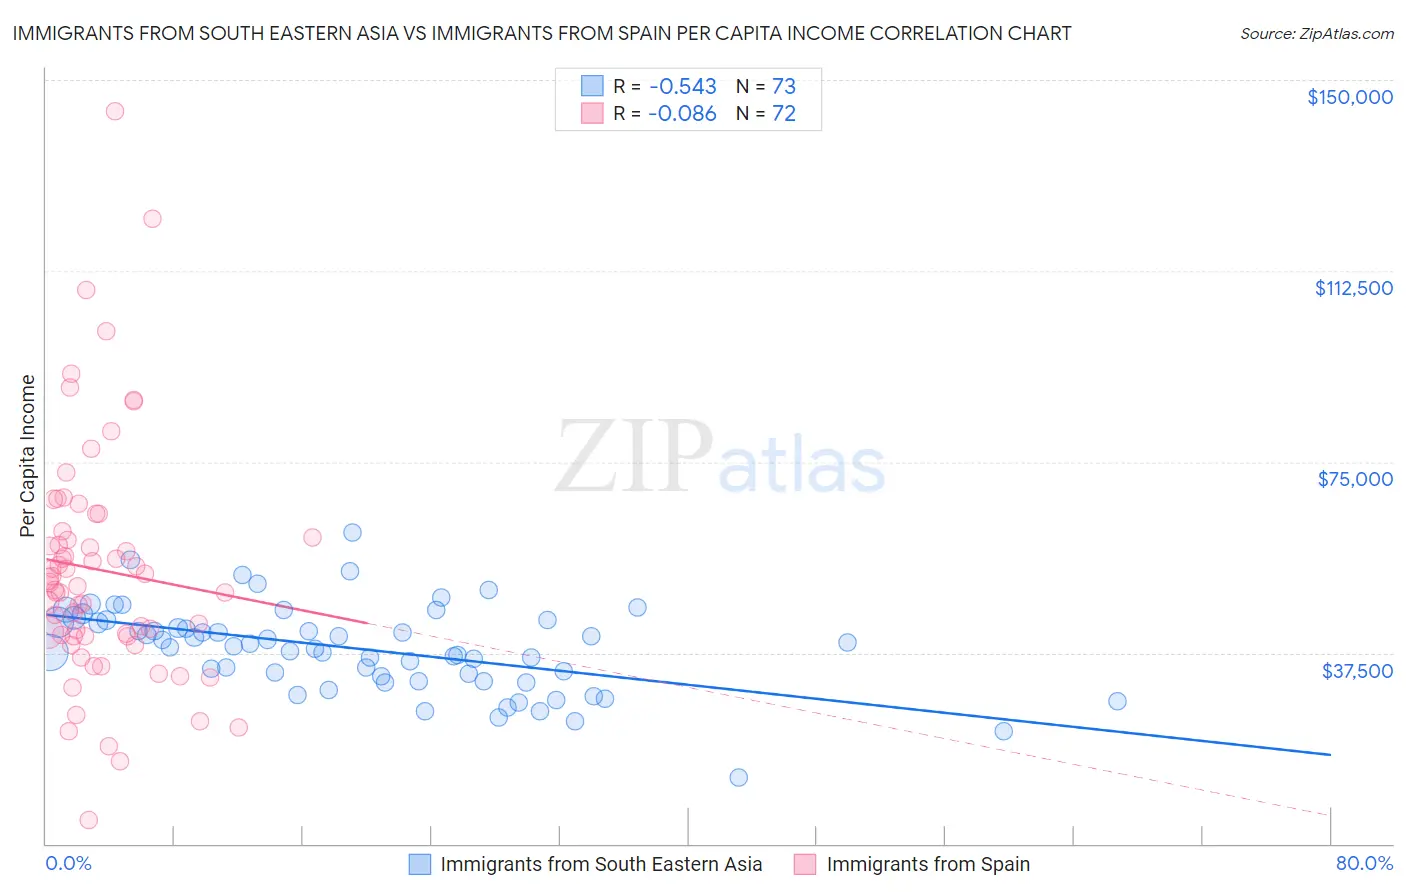
Immigrants from South Eastern Asia vs Immigrants from Spain Per Capita Income Correlation Chart

The statistical analysis conducted on geographies consisting of 512,740,931 people shows a substantial negative correlation between the proportion of Immigrants from South Eastern Asia and per capita income in the United States with a correlation coefficient (R) of -0.543 and weighted average of $43,539. Similarly, the statistical analysis conducted on geographies consisting of 239,686,141 people shows a slight negative correlation between the proportion of Immigrants from Spain and per capita income in the United States with a correlation coefficient (R) of -0.086 and weighted average of $50,933, a difference of 17.0%.
Immigrants from South Eastern Asia vs Immigrants from Spain Per Capita Income

Per Capita Income Correlation Summary

MeasurementImmigrants from South Eastern AsiaImmigrants from Spain
Minimum$12,941$4,617
Maximum$61,192$143,860
Range$48,251$139,243
Mean$38,281$53,783
Median$38,844$50,941
Interquartile 25% (IQ1)$32,392$40,770
Interquartile 75% (IQ3)$43,736$60,698
Interquartile Range (IQR)$11,344$19,928
Standard Deviation (Sample)$8,472$23,693
Standard Deviation (Population)$8,414$23,528

Similar Demographics by Per Capita Income

Demographics Similar to Immigrants from South Eastern Asia by Per Capita Income

In terms of per capita income, the demographic groups most similar to Immigrants from South Eastern Asia are Tlingit-Haida ($43,516, a difference of 0.050%), Immigrants from Costa Rica ($43,464, a difference of 0.17%), Finnish ($43,461, a difference of 0.18%), Celtic ($43,621, a difference of 0.19%), and Colombian ($43,661, a difference of 0.28%).
DemographicsRating | RankPer Capita Income
Immigrants | Peru
55.3
/100
|
#169
Average
$43,852
Scandinavians
55.2
/100
|
#170
Average
$43,848
Immigrants | Eastern Africa
54.9
/100
|
#171
Average
$43,838
Czechoslovakians
54.1
/100
|
#172
Average
$43,806
French
50.7
/100
|
#173
Average
$43,685
Colombians
50.0
/100
|
#174
Average
$43,661
Celtics
48.9
/100
|
#175
Average
$43,621
Immigrants | South Eastern Asia
46.6
/100
|
#176
Average
$43,539
Tlingit-Haida
45.9
/100
|
#177
Average
$43,516
Immigrants | Costa Rica
44.5
/100
|
#178
Average
$43,464
Finns
44.4
/100
|
#179
Average
$43,461
Sierra Leoneans
42.9
/100
|
#180
Average
$43,405
Welsh
38.2
/100
|
#181
Fair
$43,233
Immigrants | Vietnam
38.1
/100
|
#182
Fair
$43,229
Germans
33.9
/100
|
#183
Fair
$43,067

Demographics Similar to Immigrants from Spain by Per Capita Income

In terms of per capita income, the demographic groups most similar to Immigrants from Spain are Immigrants from Europe ($50,950, a difference of 0.030%), Immigrants from Latvia ($50,914, a difference of 0.040%), Bulgarian ($50,906, a difference of 0.050%), Immigrants from Serbia ($50,810, a difference of 0.24%), and New Zealander ($50,575, a difference of 0.71%).
DemographicsRating | RankPer Capita Income
Immigrants | Czechoslovakia
100.0
/100
|
#38
Exceptional
$51,770
Cambodians
100.0
/100
|
#39
Exceptional
$51,731
Immigrants | Korea
100.0
/100
|
#40
Exceptional
$51,671
Immigrants | South Africa
100.0
/100
|
#41
Exceptional
$51,465
Immigrants | Turkey
100.0
/100
|
#42
Exceptional
$51,368
Immigrants | Lithuania
100.0
/100
|
#43
Exceptional
$51,361
Immigrants | Europe
100.0
/100
|
#44
Exceptional
$50,950
Immigrants | Spain
100.0
/100
|
#45
Exceptional
$50,933
Immigrants | Latvia
100.0
/100
|
#46
Exceptional
$50,914
Bulgarians
100.0
/100
|
#47
Exceptional
$50,906
Immigrants | Serbia
100.0
/100
|
#48
Exceptional
$50,810
New Zealanders
100.0
/100
|
#49
Exceptional
$50,575
Immigrants | Sri Lanka
100.0
/100
|
#50
Exceptional
$50,555
Immigrants | Netherlands
100.0
/100
|
#51
Exceptional
$50,458
Immigrants | Croatia
99.9
/100
|
#52
Exceptional
$50,417