Immigrants from South Eastern Asia vs British West Indian Per Capita Income
COMPARE
Immigrants from South Eastern Asia
British West Indian
Per Capita Income
Per Capita Income Comparison
Immigrants from South Eastern Asia
British West Indians
$43,539
PER CAPITA INCOME
46.6/ 100
METRIC RATING
176th/ 347
METRIC RANK
$40,330
PER CAPITA INCOME
2.3/ 100
METRIC RATING
241st/ 347
METRIC RANK
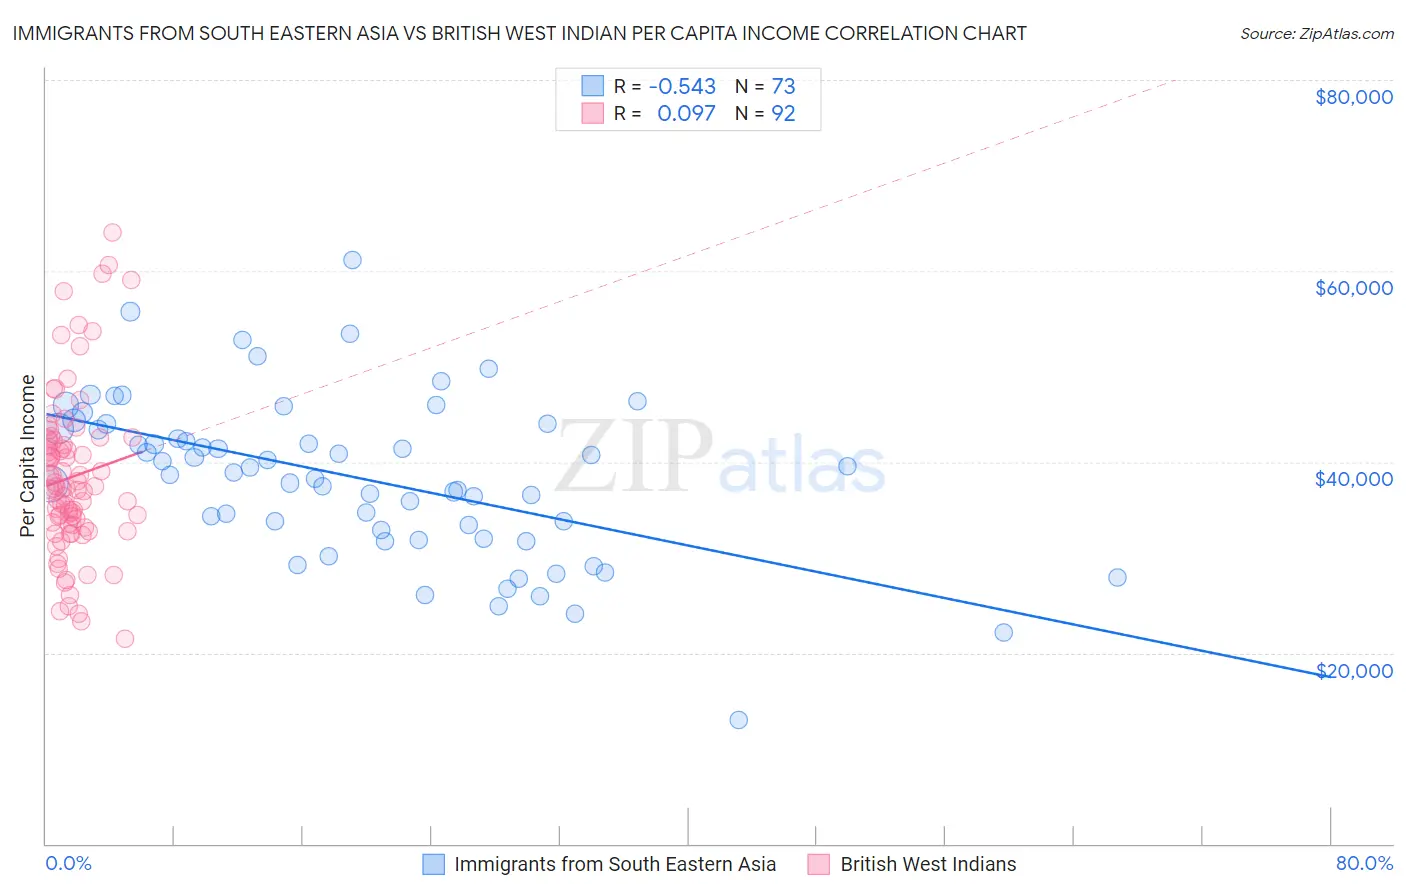
Immigrants from South Eastern Asia vs British West Indian Per Capita Income Correlation Chart
The statistical analysis conducted on geographies consisting of 512,740,931 people shows a substantial negative correlation between the proportion of Immigrants from South Eastern Asia and per capita income in the United States with a correlation coefficient (R) of -0.543 and weighted average of $43,539. Similarly, the statistical analysis conducted on geographies consisting of 152,702,927 people shows a slight positive correlation between the proportion of British West Indians and per capita income in the United States with a correlation coefficient (R) of 0.097 and weighted average of $40,330, a difference of 8.0%.
Per Capita Income Correlation Summary
| Measurement | Immigrants from South Eastern Asia | British West Indian |
| Minimum | $12,941 | $21,502 |
| Maximum | $61,192 | $63,988 |
| Range | $48,251 | $42,486 |
| Mean | $38,281 | $38,416 |
| Median | $38,844 | $37,296 |
| Interquartile 25% (IQ1) | $32,392 | $33,460 |
| Interquartile 75% (IQ3) | $43,736 | $42,145 |
| Interquartile Range (IQR) | $11,344 | $8,686 |
| Standard Deviation (Sample) | $8,472 | $8,471 |
| Standard Deviation (Population) | $8,414 | $8,425 |
Similar Demographics by Per Capita Income
Demographics Similar to Immigrants from South Eastern Asia by Per Capita Income
In terms of per capita income, the demographic groups most similar to Immigrants from South Eastern Asia are Tlingit-Haida ($43,516, a difference of 0.050%), Immigrants from Costa Rica ($43,464, a difference of 0.17%), Finnish ($43,461, a difference of 0.18%), Celtic ($43,621, a difference of 0.19%), and Colombian ($43,661, a difference of 0.28%).
| Demographics | Rating | Rank | Per Capita Income |
| Immigrants | Peru | 55.3 /100 | #169 | Average $43,852 |
| Scandinavians | 55.2 /100 | #170 | Average $43,848 |
| Immigrants | Eastern Africa | 54.9 /100 | #171 | Average $43,838 |
| Czechoslovakians | 54.1 /100 | #172 | Average $43,806 |
| French | 50.7 /100 | #173 | Average $43,685 |
| Colombians | 50.0 /100 | #174 | Average $43,661 |
| Celtics | 48.9 /100 | #175 | Average $43,621 |
| Immigrants | South Eastern Asia | 46.6 /100 | #176 | Average $43,539 |
| Tlingit-Haida | 45.9 /100 | #177 | Average $43,516 |
| Immigrants | Costa Rica | 44.5 /100 | #178 | Average $43,464 |
| Finns | 44.4 /100 | #179 | Average $43,461 |
| Sierra Leoneans | 42.9 /100 | #180 | Average $43,405 |
| Welsh | 38.2 /100 | #181 | Fair $43,233 |
| Immigrants | Vietnam | 38.1 /100 | #182 | Fair $43,229 |
| Germans | 33.9 /100 | #183 | Fair $43,067 |
Demographics Similar to British West Indians by Per Capita Income
In terms of per capita income, the demographic groups most similar to British West Indians are Immigrants from Nigeria ($40,339, a difference of 0.020%), Tsimshian ($40,344, a difference of 0.040%), Somali ($40,367, a difference of 0.090%), Immigrants from Western Africa ($40,294, a difference of 0.090%), and German Russian ($40,266, a difference of 0.16%).
| Demographics | Rating | Rank | Per Capita Income |
| Immigrants | West Indies | 3.7 /100 | #234 | Tragic $40,763 |
| Immigrants | Guyana | 3.6 /100 | #235 | Tragic $40,742 |
| Immigrants | Nonimmigrants | 3.4 /100 | #236 | Tragic $40,669 |
| Immigrants | Cambodia | 2.6 /100 | #237 | Tragic $40,434 |
| Somalis | 2.4 /100 | #238 | Tragic $40,367 |
| Tsimshian | 2.4 /100 | #239 | Tragic $40,344 |
| Immigrants | Nigeria | 2.3 /100 | #240 | Tragic $40,339 |
| British West Indians | 2.3 /100 | #241 | Tragic $40,330 |
| Immigrants | Western Africa | 2.2 /100 | #242 | Tragic $40,294 |
| German Russians | 2.2 /100 | #243 | Tragic $40,266 |
| French American Indians | 2.1 /100 | #244 | Tragic $40,244 |
| Sub-Saharan Africans | 1.9 /100 | #245 | Tragic $40,152 |
| Cree | 1.7 /100 | #246 | Tragic $40,056 |
| Immigrants | Somalia | 1.6 /100 | #247 | Tragic $39,974 |
| Cape Verdeans | 1.5 /100 | #248 | Tragic $39,935 |