Immigrants from Portugal vs Immigrants from Israel Wage/Income Gap
COMPARE
Immigrants from Portugal
Immigrants from Israel
Wage/Income Gap
Wage/Income Gap Comparison
Immigrants from Portugal
Immigrants from Israel
26.7%
WAGE/INCOME GAP
9.5/ 100
METRIC RATING
216th/ 347
METRIC RANK
28.2%
WAGE/INCOME GAP
0.3/ 100
METRIC RATING
293rd/ 347
METRIC RANK
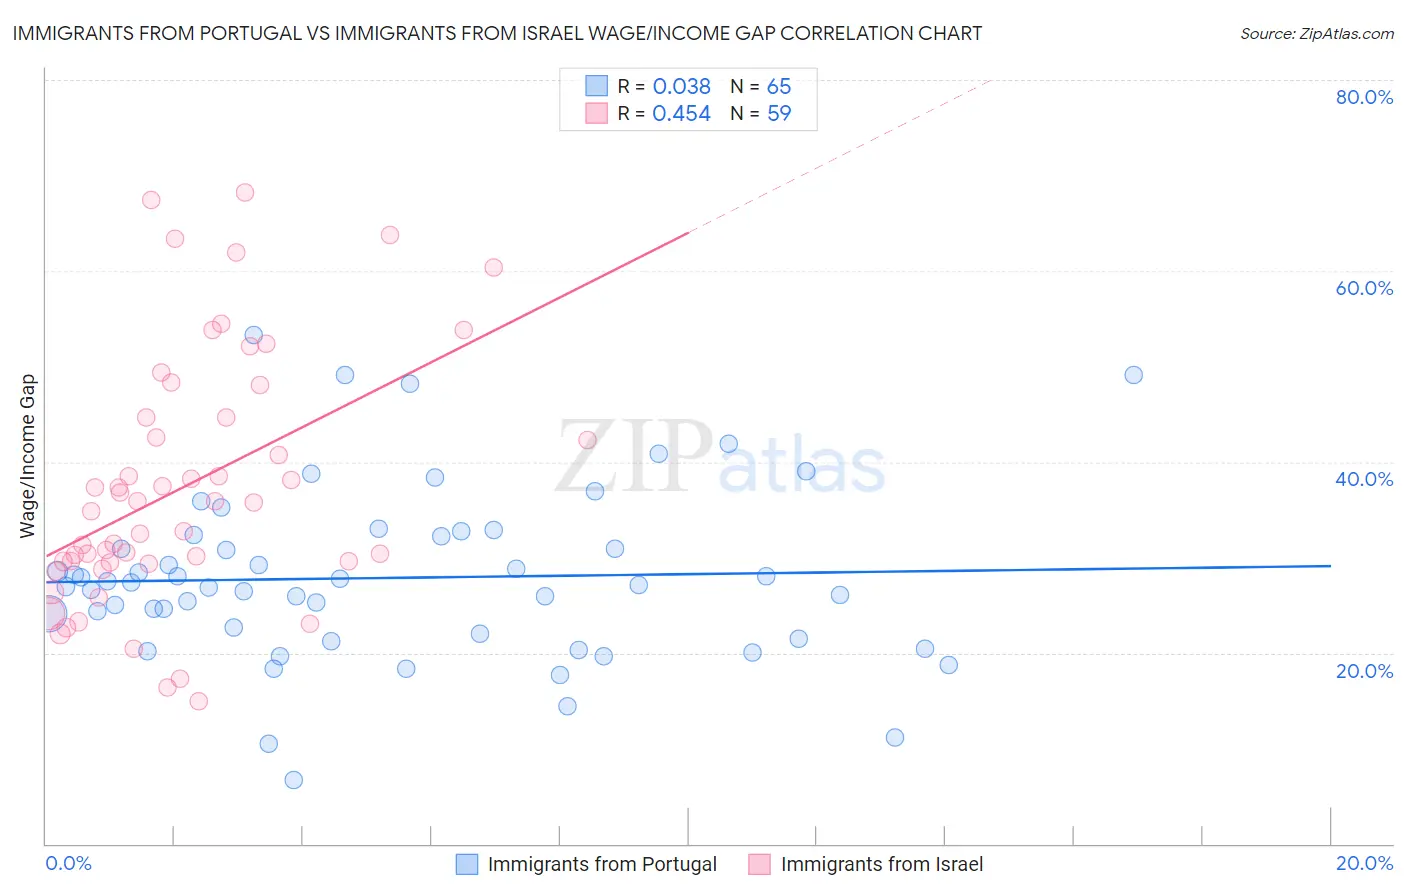
Immigrants from Portugal vs Immigrants from Israel Wage/Income Gap Correlation Chart
The statistical analysis conducted on geographies consisting of 174,735,300 people shows no correlation between the proportion of Immigrants from Portugal and wage/income gap percentage in the United States with a correlation coefficient (R) of 0.038 and weighted average of 26.7%. Similarly, the statistical analysis conducted on geographies consisting of 209,965,459 people shows a moderate positive correlation between the proportion of Immigrants from Israel and wage/income gap percentage in the United States with a correlation coefficient (R) of 0.454 and weighted average of 28.2%, a difference of 5.7%.
Wage/Income Gap Correlation Summary
| Measurement | Immigrants from Portugal | Immigrants from Israel |
| Minimum | 6.7% | 15.0% |
| Maximum | 53.3% | 68.2% |
| Range | 46.6% | 53.2% |
| Mean | 27.8% | 37.4% |
| Median | 27.1% | 35.8% |
| Interquartile 25% (IQ1) | 21.7% | 29.5% |
| Interquartile 75% (IQ3) | 32.3% | 44.7% |
| Interquartile Range (IQR) | 10.6% | 15.2% |
| Standard Deviation (Sample) | 9.0% | 13.1% |
| Standard Deviation (Population) | 9.0% | 13.0% |
Similar Demographics by Wage/Income Gap
Demographics Similar to Immigrants from Portugal by Wage/Income Gap
In terms of wage/income gap, the demographic groups most similar to Immigrants from Portugal are Yugoslavian (26.7%, a difference of 0.040%), Brazilian (26.7%, a difference of 0.050%), Immigrants from Saudi Arabia (26.7%, a difference of 0.080%), Immigrants from Poland (26.7%, a difference of 0.11%), and Immigrants from Latvia (26.7%, a difference of 0.12%).
| Demographics | Rating | Rank | Wage/Income Gap |
| Immigrants | Kuwait | 12.6 /100 | #209 | Poor 26.6% |
| Arabs | 12.3 /100 | #210 | Poor 26.6% |
| Mongolians | 11.4 /100 | #211 | Poor 26.6% |
| Iraqis | 11.2 /100 | #212 | Poor 26.6% |
| Immigrants | Iraq | 10.3 /100 | #213 | Poor 26.7% |
| Immigrants | China | 10.3 /100 | #214 | Poor 26.7% |
| Yugoslavians | 9.7 /100 | #215 | Tragic 26.7% |
| Immigrants | Portugal | 9.5 /100 | #216 | Tragic 26.7% |
| Brazilians | 9.2 /100 | #217 | Tragic 26.7% |
| Immigrants | Saudi Arabia | 9.1 /100 | #218 | Tragic 26.7% |
| Immigrants | Poland | 8.9 /100 | #219 | Tragic 26.7% |
| Immigrants | Latvia | 8.9 /100 | #220 | Tragic 26.7% |
| Immigrants | Spain | 8.5 /100 | #221 | Tragic 26.8% |
| Bolivians | 8.3 /100 | #222 | Tragic 26.8% |
| Jordanians | 8.0 /100 | #223 | Tragic 26.8% |
Demographics Similar to Immigrants from Israel by Wage/Income Gap
In terms of wage/income gap, the demographic groups most similar to Immigrants from Israel are Greek (28.2%, a difference of 0.020%), Immigrants from Australia (28.2%, a difference of 0.11%), Slovene (28.3%, a difference of 0.15%), Czechoslovakian (28.2%, a difference of 0.16%), and Northern European (28.3%, a difference of 0.16%).
| Demographics | Rating | Rank | Wage/Income Gap |
| Immigrants | Austria | 0.4 /100 | #286 | Tragic 28.1% |
| Okinawans | 0.4 /100 | #287 | Tragic 28.1% |
| Choctaw | 0.4 /100 | #288 | Tragic 28.1% |
| Canadians | 0.3 /100 | #289 | Tragic 28.1% |
| Australians | 0.3 /100 | #290 | Tragic 28.2% |
| Czechoslovakians | 0.3 /100 | #291 | Tragic 28.2% |
| Immigrants | Australia | 0.3 /100 | #292 | Tragic 28.2% |
| Immigrants | Israel | 0.3 /100 | #293 | Tragic 28.2% |
| Greeks | 0.3 /100 | #294 | Tragic 28.2% |
| Slovenes | 0.3 /100 | #295 | Tragic 28.3% |
| Northern Europeans | 0.3 /100 | #296 | Tragic 28.3% |
| Immigrants | North America | 0.2 /100 | #297 | Tragic 28.4% |
| Austrians | 0.2 /100 | #298 | Tragic 28.4% |
| Immigrants | North Macedonia | 0.2 /100 | #299 | Tragic 28.4% |
| Immigrants | Northern Europe | 0.2 /100 | #300 | Tragic 28.5% |