Immigrants from Peru vs Immigrants from Cabo Verde Wage/Income Gap
COMPARE
Immigrants from Peru
Immigrants from Cabo Verde
Wage/Income Gap
Wage/Income Gap Comparison
Immigrants from Peru
Immigrants from Cabo Verde
25.1%
WAGE/INCOME GAP
82.6/ 100
METRIC RATING
149th/ 347
METRIC RANK
23.6%
WAGE/INCOME GAP
99.5/ 100
METRIC RATING
93rd/ 347
METRIC RANK
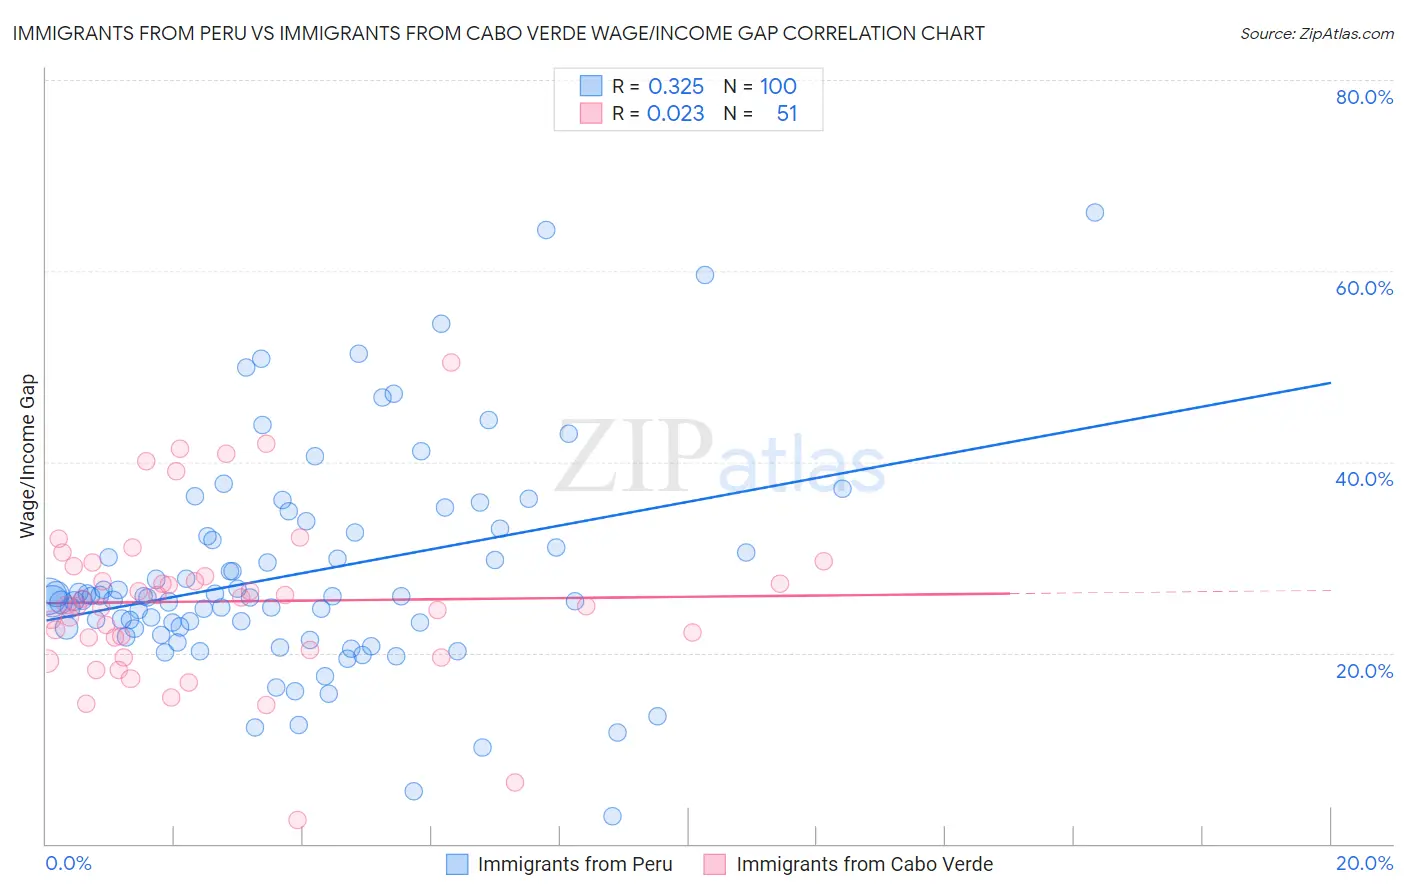
Immigrants from Peru vs Immigrants from Cabo Verde Wage/Income Gap Correlation Chart
The statistical analysis conducted on geographies consisting of 328,741,739 people shows a mild positive correlation between the proportion of Immigrants from Peru and wage/income gap percentage in the United States with a correlation coefficient (R) of 0.325 and weighted average of 25.1%. Similarly, the statistical analysis conducted on geographies consisting of 38,157,799 people shows no correlation between the proportion of Immigrants from Cabo Verde and wage/income gap percentage in the United States with a correlation coefficient (R) of 0.023 and weighted average of 23.6%, a difference of 6.6%.
Wage/Income Gap Correlation Summary
| Measurement | Immigrants from Peru | Immigrants from Cabo Verde |
| Minimum | 2.9% | 2.5% |
| Maximum | 66.2% | 50.5% |
| Range | 63.3% | 48.0% |
| Mean | 28.2% | 25.4% |
| Median | 25.8% | 25.0% |
| Interquartile 25% (IQ1) | 22.6% | 20.3% |
| Interquartile 75% (IQ3) | 32.4% | 29.1% |
| Interquartile Range (IQR) | 9.8% | 8.8% |
| Standard Deviation (Sample) | 11.3% | 8.6% |
| Standard Deviation (Population) | 11.2% | 8.5% |
Similar Demographics by Wage/Income Gap
Demographics Similar to Immigrants from Peru by Wage/Income Gap
In terms of wage/income gap, the demographic groups most similar to Immigrants from Peru are Immigrants (25.1%, a difference of 0.040%), Taiwanese (25.1%, a difference of 0.12%), Iroquois (25.1%, a difference of 0.15%), Uruguayan (25.2%, a difference of 0.16%), and Malaysian (25.0%, a difference of 0.28%).
| Demographics | Rating | Rank | Wage/Income Gap |
| Afghans | 88.1 /100 | #142 | Excellent 24.9% |
| Immigrants | Uganda | 88.0 /100 | #143 | Excellent 24.9% |
| Chippewa | 86.9 /100 | #144 | Excellent 25.0% |
| Comanche | 85.2 /100 | #145 | Excellent 25.0% |
| South Americans | 85.2 /100 | #146 | Excellent 25.0% |
| Malaysians | 84.9 /100 | #147 | Excellent 25.0% |
| Iroquois | 83.9 /100 | #148 | Excellent 25.1% |
| Immigrants | Peru | 82.6 /100 | #149 | Excellent 25.1% |
| Immigrants | Immigrants | 82.3 /100 | #150 | Excellent 25.1% |
| Taiwanese | 81.6 /100 | #151 | Excellent 25.1% |
| Uruguayans | 81.3 /100 | #152 | Excellent 25.2% |
| Blackfeet | 78.1 /100 | #153 | Good 25.2% |
| Immigrants | Northern Africa | 78.1 /100 | #154 | Good 25.2% |
| Immigrants | Vietnam | 77.7 /100 | #155 | Good 25.2% |
| Immigrants | Mexico | 76.4 /100 | #156 | Good 25.3% |
Demographics Similar to Immigrants from Cabo Verde by Wage/Income Gap
In terms of wage/income gap, the demographic groups most similar to Immigrants from Cabo Verde are Honduran (23.6%, a difference of 0.090%), Cape Verdean (23.6%, a difference of 0.12%), Immigrants from Honduras (23.5%, a difference of 0.24%), Kiowa (23.6%, a difference of 0.24%), and Immigrants from Sudan (23.6%, a difference of 0.33%).
| Demographics | Rating | Rank | Wage/Income Gap |
| Cheyenne | 99.7 /100 | #86 | Exceptional 23.3% |
| Yuman | 99.7 /100 | #87 | Exceptional 23.3% |
| Immigrants | Panama | 99.6 /100 | #88 | Exceptional 23.4% |
| Marshallese | 99.6 /100 | #89 | Exceptional 23.4% |
| Nicaraguans | 99.6 /100 | #90 | Exceptional 23.4% |
| Arapaho | 99.6 /100 | #91 | Exceptional 23.5% |
| Immigrants | Honduras | 99.5 /100 | #92 | Exceptional 23.5% |
| Immigrants | Cabo Verde | 99.5 /100 | #93 | Exceptional 23.6% |
| Hondurans | 99.5 /100 | #94 | Exceptional 23.6% |
| Cape Verdeans | 99.4 /100 | #95 | Exceptional 23.6% |
| Kiowa | 99.4 /100 | #96 | Exceptional 23.6% |
| Immigrants | Sudan | 99.4 /100 | #97 | Exceptional 23.6% |
| Immigrants | Latin America | 99.2 /100 | #98 | Exceptional 23.7% |
| Aleuts | 99.2 /100 | #99 | Exceptional 23.7% |
| Yakama | 99.2 /100 | #100 | Exceptional 23.7% |