Immigrants from Netherlands vs Immigrants from Bulgaria Wage/Income Gap
COMPARE
Immigrants from Netherlands
Immigrants from Bulgaria
Wage/Income Gap
Wage/Income Gap Comparison
Immigrants from Netherlands
Immigrants from Bulgaria
28.5%
WAGE/INCOME GAP
0.2/ 100
METRIC RATING
304th/ 347
METRIC RANK
26.3%
WAGE/INCOME GAP
22.5/ 100
METRIC RATING
192nd/ 347
METRIC RANK
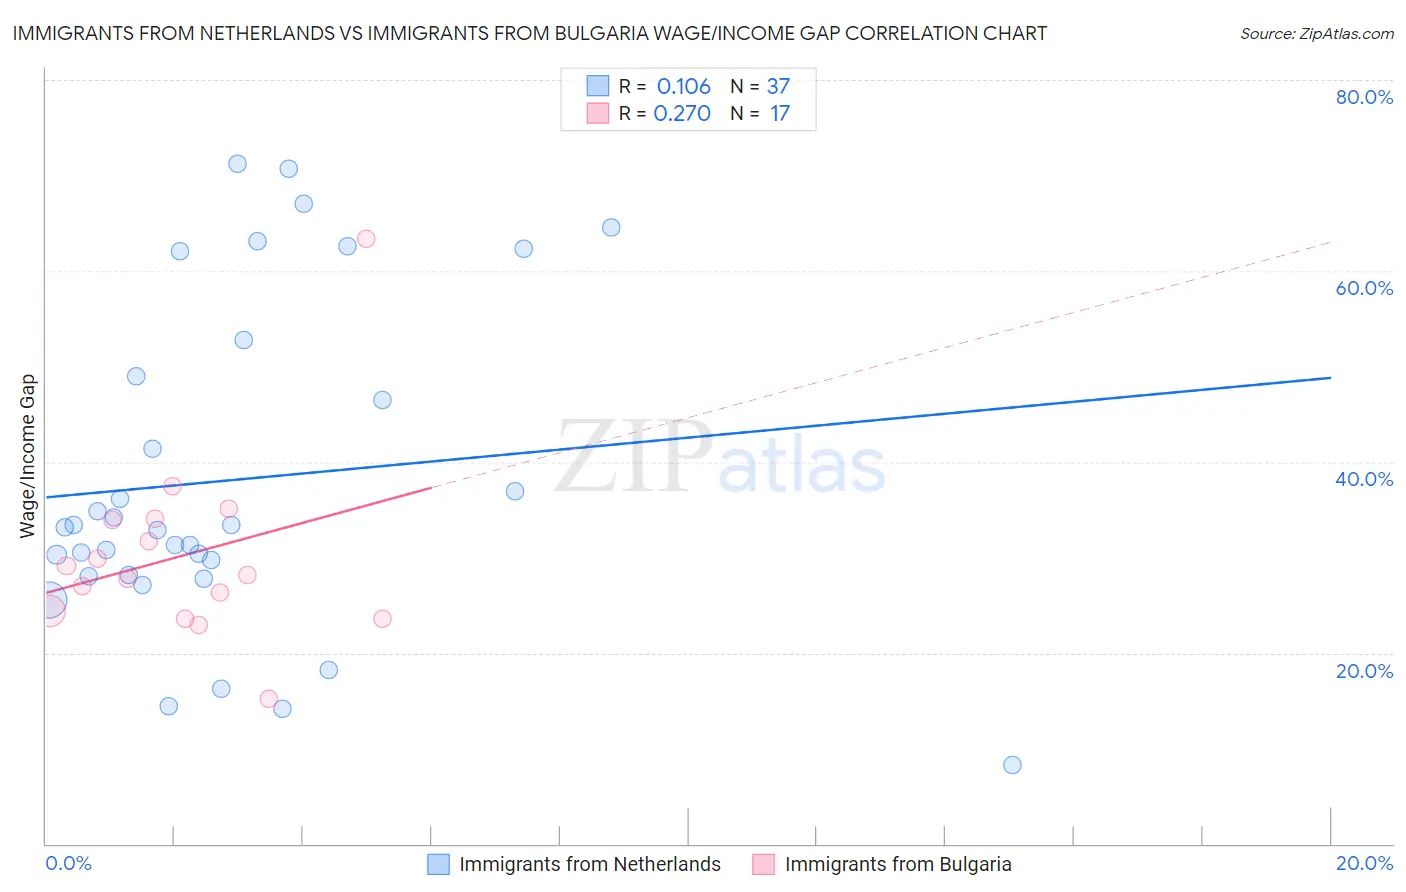
Immigrants from Netherlands vs Immigrants from Bulgaria Wage/Income Gap Correlation Chart
The statistical analysis conducted on geographies consisting of 237,766,220 people shows a poor positive correlation between the proportion of Immigrants from Netherlands and wage/income gap percentage in the United States with a correlation coefficient (R) of 0.106 and weighted average of 28.5%. Similarly, the statistical analysis conducted on geographies consisting of 172,517,670 people shows a weak positive correlation between the proportion of Immigrants from Bulgaria and wage/income gap percentage in the United States with a correlation coefficient (R) of 0.270 and weighted average of 26.3%, a difference of 8.4%.
Wage/Income Gap Correlation Summary
| Measurement | Immigrants from Netherlands | Immigrants from Bulgaria |
| Minimum | 8.2% | 15.1% |
| Maximum | 71.2% | 63.4% |
| Range | 63.0% | 48.3% |
| Mean | 38.1% | 30.2% |
| Median | 33.2% | 28.2% |
| Interquartile 25% (IQ1) | 28.1% | 24.0% |
| Interquartile 75% (IQ3) | 50.9% | 34.0% |
| Interquartile Range (IQR) | 22.8% | 10.0% |
| Standard Deviation (Sample) | 17.1% | 10.2% |
| Standard Deviation (Population) | 16.9% | 9.8% |
Similar Demographics by Wage/Income Gap
Demographics Similar to Immigrants from Netherlands by Wage/Income Gap
In terms of wage/income gap, the demographic groups most similar to Immigrants from Netherlands are Immigrants from South Africa (28.5%, a difference of 0.020%), White/Caucasian (28.5%, a difference of 0.060%), Immigrants from Denmark (28.5%, a difference of 0.070%), Scotch-Irish (28.5%, a difference of 0.080%), and Irish (28.5%, a difference of 0.080%).
| Demographics | Rating | Rank | Wage/Income Gap |
| Immigrants | North America | 0.2 /100 | #297 | Tragic 28.4% |
| Austrians | 0.2 /100 | #298 | Tragic 28.4% |
| Immigrants | North Macedonia | 0.2 /100 | #299 | Tragic 28.4% |
| Immigrants | Northern Europe | 0.2 /100 | #300 | Tragic 28.5% |
| Immigrants | Canada | 0.2 /100 | #301 | Tragic 28.5% |
| Scotch-Irish | 0.2 /100 | #302 | Tragic 28.5% |
| Irish | 0.2 /100 | #303 | Tragic 28.5% |
| Immigrants | Netherlands | 0.2 /100 | #304 | Tragic 28.5% |
| Immigrants | South Africa | 0.1 /100 | #305 | Tragic 28.5% |
| Whites/Caucasians | 0.1 /100 | #306 | Tragic 28.5% |
| Immigrants | Denmark | 0.1 /100 | #307 | Tragic 28.5% |
| Poles | 0.1 /100 | #308 | Tragic 28.5% |
| Macedonians | 0.1 /100 | #309 | Tragic 28.6% |
| Finns | 0.1 /100 | #310 | Tragic 28.6% |
| Immigrants | Lithuania | 0.1 /100 | #311 | Tragic 28.6% |
Demographics Similar to Immigrants from Bulgaria by Wage/Income Gap
In terms of wage/income gap, the demographic groups most similar to Immigrants from Bulgaria are Immigrants from Jordan (26.3%, a difference of 0.020%), Chilean (26.3%, a difference of 0.020%), Immigrants from Malaysia (26.3%, a difference of 0.030%), Immigrants from Western Asia (26.3%, a difference of 0.080%), and Zimbabwean (26.3%, a difference of 0.090%).
| Demographics | Rating | Rank | Wage/Income Gap |
| Pakistanis | 33.7 /100 | #185 | Fair 26.1% |
| Immigrants | Indonesia | 32.5 /100 | #186 | Fair 26.1% |
| Palestinians | 29.9 /100 | #187 | Fair 26.1% |
| Immigrants | Egypt | 29.9 /100 | #188 | Fair 26.1% |
| Immigrants | Moldova | 26.6 /100 | #189 | Fair 26.2% |
| Immigrants | Croatia | 24.8 /100 | #190 | Fair 26.2% |
| Immigrants | Venezuela | 24.7 /100 | #191 | Fair 26.2% |
| Immigrants | Bulgaria | 22.5 /100 | #192 | Fair 26.3% |
| Immigrants | Jordan | 22.4 /100 | #193 | Fair 26.3% |
| Chileans | 22.3 /100 | #194 | Fair 26.3% |
| Immigrants | Malaysia | 22.2 /100 | #195 | Fair 26.3% |
| Immigrants | Western Asia | 21.7 /100 | #196 | Fair 26.3% |
| Zimbabweans | 21.6 /100 | #197 | Fair 26.3% |
| Venezuelans | 21.5 /100 | #198 | Fair 26.3% |
| Dutch West Indians | 21.0 /100 | #199 | Fair 26.3% |