Immigrants from Belgium vs Immigrants from Bulgaria Wage/Income Gap
COMPARE
Immigrants from Belgium
Immigrants from Bulgaria
Wage/Income Gap
Wage/Income Gap Comparison
Immigrants from Belgium
Immigrants from Bulgaria
29.0%
WAGE/INCOME GAP
0.0/ 100
METRIC RATING
326th/ 347
METRIC RANK
26.3%
WAGE/INCOME GAP
22.5/ 100
METRIC RATING
192nd/ 347
METRIC RANK
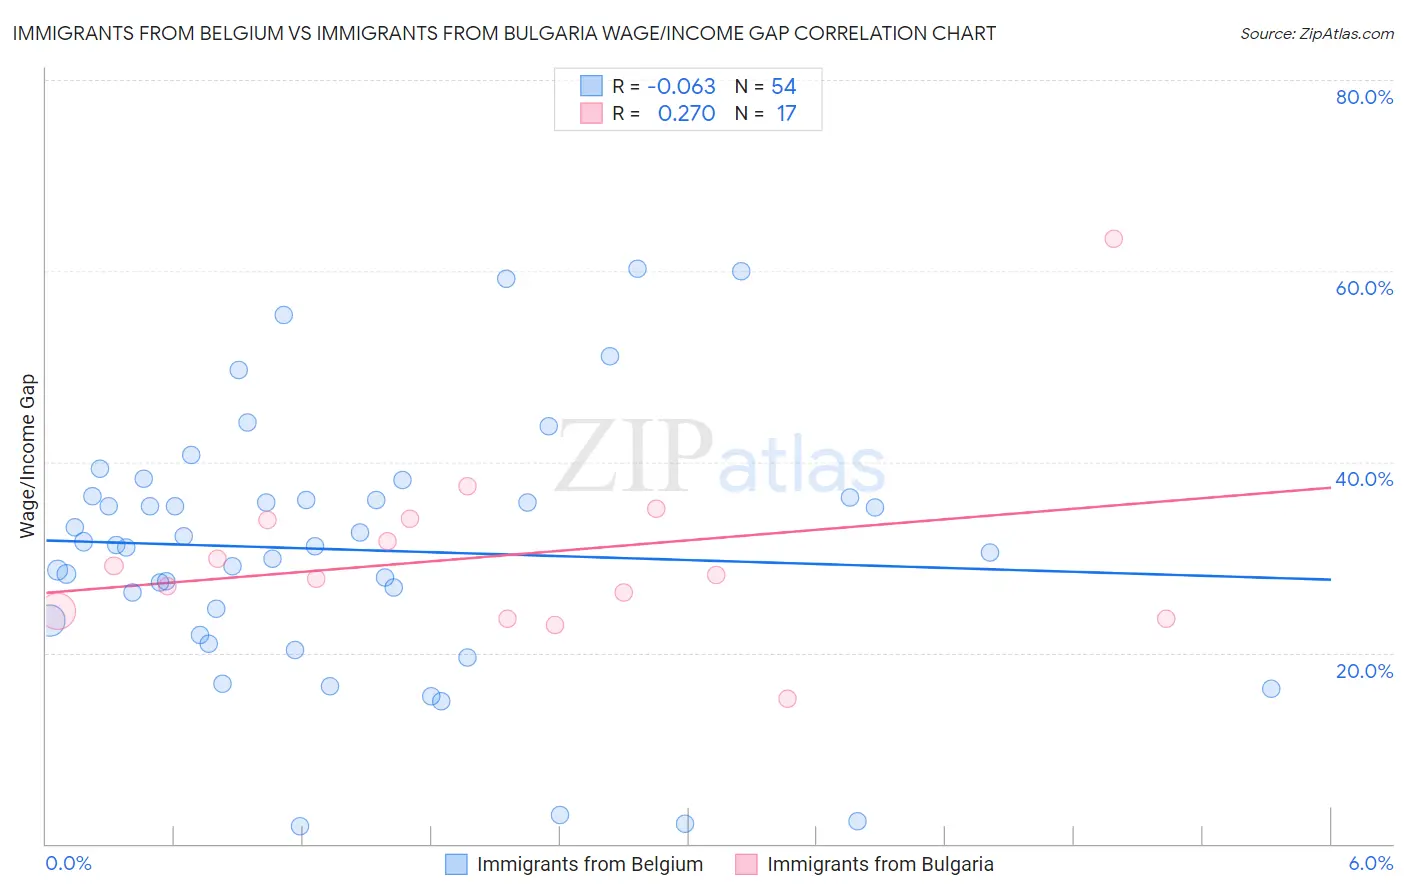
Immigrants from Belgium vs Immigrants from Bulgaria Wage/Income Gap Correlation Chart
The statistical analysis conducted on geographies consisting of 146,675,881 people shows a slight negative correlation between the proportion of Immigrants from Belgium and wage/income gap percentage in the United States with a correlation coefficient (R) of -0.063 and weighted average of 29.0%. Similarly, the statistical analysis conducted on geographies consisting of 172,517,670 people shows a weak positive correlation between the proportion of Immigrants from Bulgaria and wage/income gap percentage in the United States with a correlation coefficient (R) of 0.270 and weighted average of 26.3%, a difference of 10.5%.
Wage/Income Gap Correlation Summary
| Measurement | Immigrants from Belgium | Immigrants from Bulgaria |
| Minimum | 1.8% | 15.1% |
| Maximum | 60.2% | 63.4% |
| Range | 58.4% | 48.3% |
| Mean | 30.8% | 30.2% |
| Median | 31.2% | 28.2% |
| Interquartile 25% (IQ1) | 23.4% | 24.0% |
| Interquartile 75% (IQ3) | 36.3% | 34.0% |
| Interquartile Range (IQR) | 12.9% | 10.0% |
| Standard Deviation (Sample) | 13.5% | 10.2% |
| Standard Deviation (Population) | 13.4% | 9.8% |
Similar Demographics by Wage/Income Gap
Demographics Similar to Immigrants from Belgium by Wage/Income Gap
In terms of wage/income gap, the demographic groups most similar to Immigrants from Belgium are Hungarian (29.0%, a difference of 0.070%), Immigrants from Iran (29.1%, a difference of 0.11%), Scandinavian (29.1%, a difference of 0.17%), Croatian (29.0%, a difference of 0.20%), and Scottish (29.1%, a difference of 0.31%).
| Demographics | Rating | Rank | Wage/Income Gap |
| Slovaks | 0.1 /100 | #319 | Tragic 28.9% |
| British | 0.1 /100 | #320 | Tragic 28.9% |
| Welsh | 0.1 /100 | #321 | Tragic 28.9% |
| Immigrants | Singapore | 0.1 /100 | #322 | Tragic 28.9% |
| Norwegians | 0.1 /100 | #323 | Tragic 29.0% |
| Croatians | 0.0 /100 | #324 | Tragic 29.0% |
| Hungarians | 0.0 /100 | #325 | Tragic 29.0% |
| Immigrants | Belgium | 0.0 /100 | #326 | Tragic 29.0% |
| Immigrants | Iran | 0.0 /100 | #327 | Tragic 29.1% |
| Scandinavians | 0.0 /100 | #328 | Tragic 29.1% |
| Scottish | 0.0 /100 | #329 | Tragic 29.1% |
| Germans | 0.0 /100 | #330 | Tragic 29.2% |
| Czechs | 0.0 /100 | #331 | Tragic 29.2% |
| Immigrants | South Central Asia | 0.0 /100 | #332 | Tragic 29.3% |
| Europeans | 0.0 /100 | #333 | Tragic 29.4% |
Demographics Similar to Immigrants from Bulgaria by Wage/Income Gap
In terms of wage/income gap, the demographic groups most similar to Immigrants from Bulgaria are Immigrants from Jordan (26.3%, a difference of 0.020%), Chilean (26.3%, a difference of 0.020%), Immigrants from Malaysia (26.3%, a difference of 0.030%), Immigrants from Western Asia (26.3%, a difference of 0.080%), and Zimbabwean (26.3%, a difference of 0.090%).
| Demographics | Rating | Rank | Wage/Income Gap |
| Pakistanis | 33.7 /100 | #185 | Fair 26.1% |
| Immigrants | Indonesia | 32.5 /100 | #186 | Fair 26.1% |
| Palestinians | 29.9 /100 | #187 | Fair 26.1% |
| Immigrants | Egypt | 29.9 /100 | #188 | Fair 26.1% |
| Immigrants | Moldova | 26.6 /100 | #189 | Fair 26.2% |
| Immigrants | Croatia | 24.8 /100 | #190 | Fair 26.2% |
| Immigrants | Venezuela | 24.7 /100 | #191 | Fair 26.2% |
| Immigrants | Bulgaria | 22.5 /100 | #192 | Fair 26.3% |
| Immigrants | Jordan | 22.4 /100 | #193 | Fair 26.3% |
| Chileans | 22.3 /100 | #194 | Fair 26.3% |
| Immigrants | Malaysia | 22.2 /100 | #195 | Fair 26.3% |
| Immigrants | Western Asia | 21.7 /100 | #196 | Fair 26.3% |
| Zimbabweans | 21.6 /100 | #197 | Fair 26.3% |
| Venezuelans | 21.5 /100 | #198 | Fair 26.3% |
| Dutch West Indians | 21.0 /100 | #199 | Fair 26.3% |