Immigrants from Moldova vs Albanian 1st Grade
COMPARE
Immigrants from Moldova
Albanian
1st Grade
1st Grade Comparison
Immigrants from Moldova
Albanians
98.0%
1ST GRADE
69.5/ 100
METRIC RATING
152nd/ 347
METRIC RANK
97.9%
1ST GRADE
49.6/ 100
METRIC RATING
176th/ 347
METRIC RANK
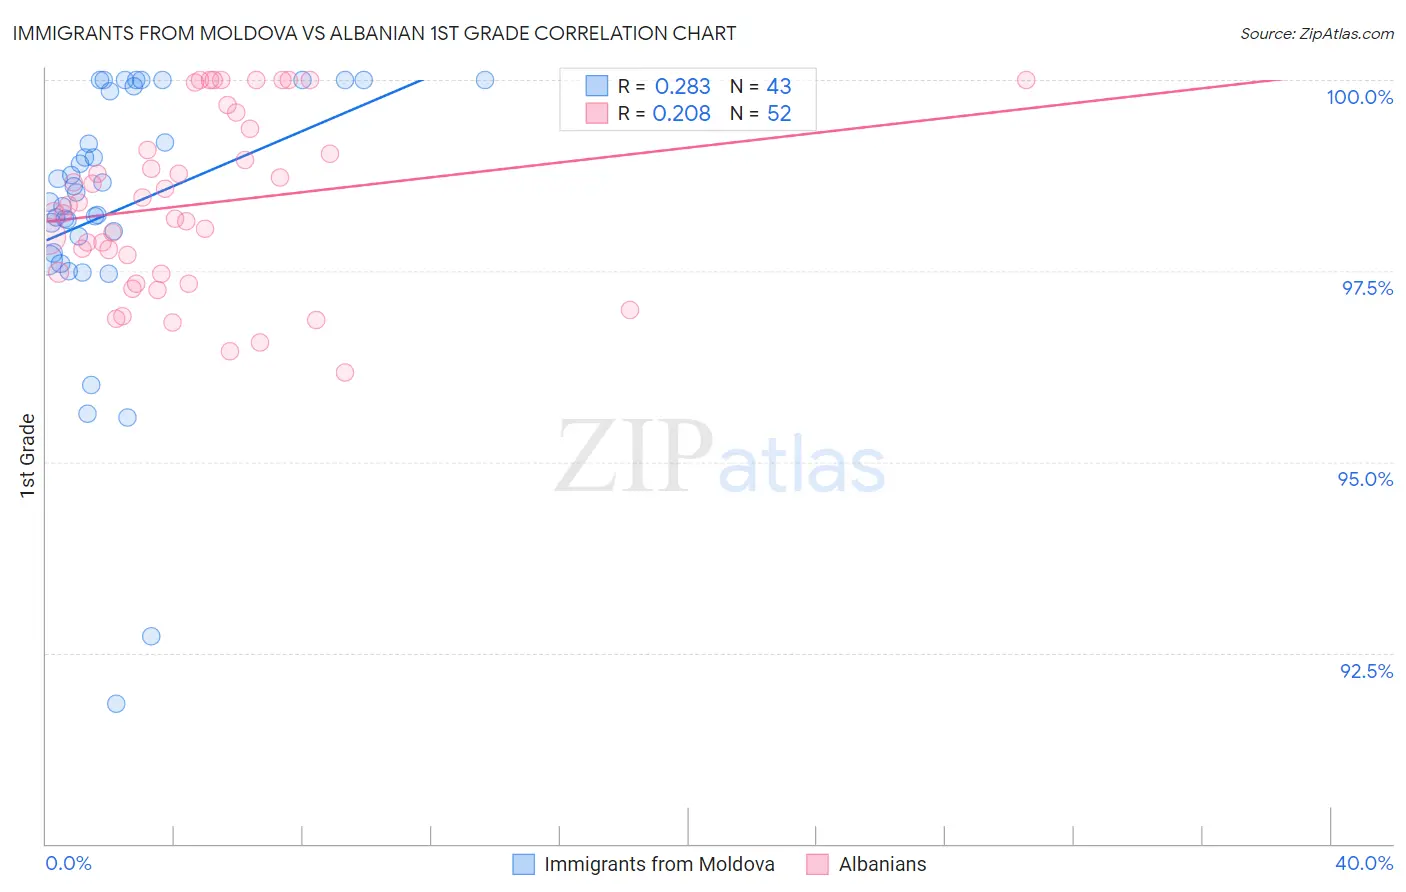
Immigrants from Moldova vs Albanian 1st Grade Correlation Chart
The statistical analysis conducted on geographies consisting of 124,398,501 people shows a weak positive correlation between the proportion of Immigrants from Moldova and percentage of population with at least 1st grade education in the United States with a correlation coefficient (R) of 0.283 and weighted average of 98.0%. Similarly, the statistical analysis conducted on geographies consisting of 193,265,850 people shows a weak positive correlation between the proportion of Albanians and percentage of population with at least 1st grade education in the United States with a correlation coefficient (R) of 0.208 and weighted average of 97.9%, a difference of 0.070%.
1st Grade Correlation Summary
| Measurement | Immigrants from Moldova | Albanian |
| Minimum | 91.8% | 96.2% |
| Maximum | 100.0% | 100.0% |
| Range | 8.2% | 3.8% |
| Mean | 98.3% | 98.4% |
| Median | 98.5% | 98.3% |
| Interquartile 25% (IQ1) | 97.7% | 97.5% |
| Interquartile 75% (IQ3) | 99.9% | 99.2% |
| Interquartile Range (IQR) | 2.2% | 1.8% |
| Standard Deviation (Sample) | 1.8% | 1.1% |
| Standard Deviation (Population) | 1.8% | 1.1% |
Similar Demographics by 1st Grade
Demographics Similar to Immigrants from Moldova by 1st Grade
In terms of 1st grade, the demographic groups most similar to Immigrants from Moldova are Dutch West Indian (98.0%, a difference of 0.0%), Soviet Union (98.0%, a difference of 0.0%), Jordanian (98.0%, a difference of 0.010%), Immigrants from Iran (98.0%, a difference of 0.010%), and Comanche (98.0%, a difference of 0.010%).
| Demographics | Rating | Rank | 1st Grade |
| Hmong | 79.0 /100 | #145 | Good 98.0% |
| Immigrants | Israel | 77.8 /100 | #146 | Good 98.0% |
| Filipinos | 77.6 /100 | #147 | Good 98.0% |
| Apache | 75.2 /100 | #148 | Good 98.0% |
| Immigrants | Greece | 74.9 /100 | #149 | Good 98.0% |
| Jordanians | 72.7 /100 | #150 | Good 98.0% |
| Dutch West Indians | 69.8 /100 | #151 | Good 98.0% |
| Immigrants | Moldova | 69.5 /100 | #152 | Good 98.0% |
| Soviet Union | 68.9 /100 | #153 | Good 98.0% |
| Immigrants | Iran | 66.9 /100 | #154 | Good 98.0% |
| Comanche | 66.9 /100 | #155 | Good 98.0% |
| Immigrants | South Central Asia | 66.2 /100 | #156 | Good 98.0% |
| Immigrants | North Macedonia | 65.3 /100 | #157 | Good 98.0% |
| Venezuelans | 64.7 /100 | #158 | Good 98.0% |
| French American Indians | 63.7 /100 | #159 | Good 98.0% |
Demographics Similar to Albanians by 1st Grade
In terms of 1st grade, the demographic groups most similar to Albanians are Kenyan (97.9%, a difference of 0.0%), Native/Alaskan (97.9%, a difference of 0.0%), Immigrants from Sri Lanka (97.9%, a difference of 0.0%), Immigrants from Brazil (97.9%, a difference of 0.0%), and Immigrants from Jordan (97.9%, a difference of 0.010%).
| Demographics | Rating | Rank | 1st Grade |
| Immigrants | Micronesia | 55.3 /100 | #169 | Average 97.9% |
| Immigrants | Spain | 54.9 /100 | #170 | Average 97.9% |
| Immigrants | Jordan | 53.9 /100 | #171 | Average 97.9% |
| Immigrants | Korea | 53.0 /100 | #172 | Average 97.9% |
| Kenyans | 51.2 /100 | #173 | Average 97.9% |
| Natives/Alaskans | 50.0 /100 | #174 | Average 97.9% |
| Immigrants | Sri Lanka | 49.7 /100 | #175 | Average 97.9% |
| Albanians | 49.6 /100 | #176 | Average 97.9% |
| Immigrants | Brazil | 49.1 /100 | #177 | Average 97.9% |
| Immigrants | Venezuela | 47.8 /100 | #178 | Average 97.9% |
| Argentineans | 47.2 /100 | #179 | Average 97.9% |
| Immigrants | Bosnia and Herzegovina | 46.6 /100 | #180 | Average 97.9% |
| Portuguese | 44.2 /100 | #181 | Average 97.9% |
| Egyptians | 42.7 /100 | #182 | Average 97.9% |
| Immigrants | Argentina | 41.3 /100 | #183 | Average 97.9% |