Immigrants from Micronesia vs Immigrants from Taiwan Wage/Income Gap
COMPARE
Immigrants from Micronesia
Immigrants from Taiwan
Wage/Income Gap
Wage/Income Gap Comparison
Immigrants from Micronesia
Immigrants from Taiwan
24.4%
WAGE/INCOME GAP
95.8/ 100
METRIC RATING
118th/ 347
METRIC RANK
29.5%
WAGE/INCOME GAP
0.0/ 100
METRIC RATING
335th/ 347
METRIC RANK
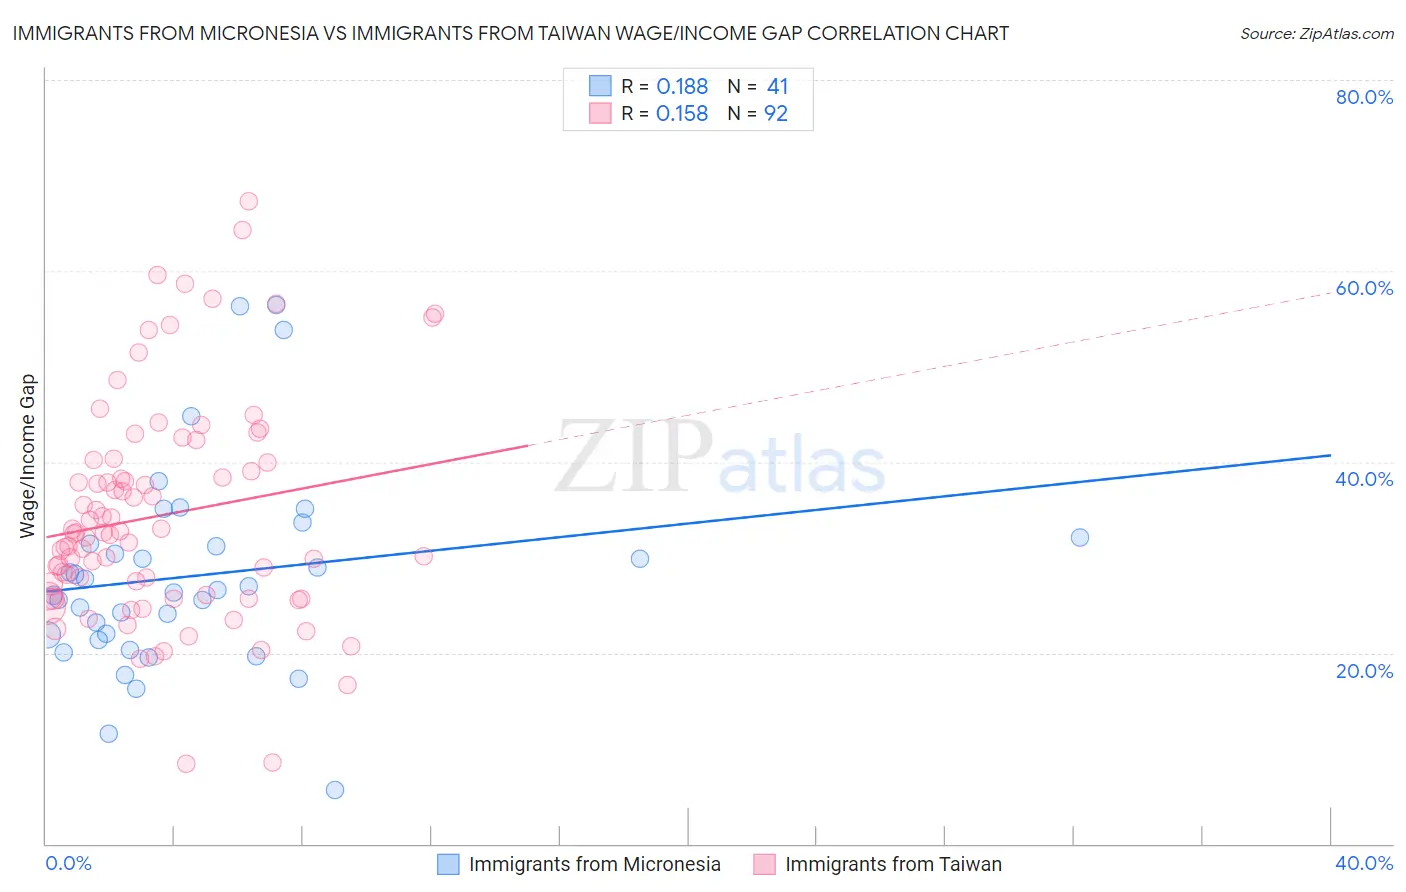
Immigrants from Micronesia vs Immigrants from Taiwan Wage/Income Gap Correlation Chart
The statistical analysis conducted on geographies consisting of 61,599,093 people shows a poor positive correlation between the proportion of Immigrants from Micronesia and wage/income gap percentage in the United States with a correlation coefficient (R) of 0.188 and weighted average of 24.4%. Similarly, the statistical analysis conducted on geographies consisting of 298,208,657 people shows a poor positive correlation between the proportion of Immigrants from Taiwan and wage/income gap percentage in the United States with a correlation coefficient (R) of 0.158 and weighted average of 29.5%, a difference of 20.5%.
Wage/Income Gap Correlation Summary
| Measurement | Immigrants from Micronesia | Immigrants from Taiwan |
| Minimum | 5.7% | 8.4% |
| Maximum | 56.5% | 67.2% |
| Range | 50.8% | 58.8% |
| Mean | 28.1% | 34.4% |
| Median | 26.6% | 32.5% |
| Interquartile 25% (IQ1) | 21.6% | 26.0% |
| Interquartile 75% (IQ3) | 31.8% | 40.1% |
| Interquartile Range (IQR) | 10.1% | 14.1% |
| Standard Deviation (Sample) | 10.6% | 11.6% |
| Standard Deviation (Population) | 10.5% | 11.5% |
Similar Demographics by Wage/Income Gap
Demographics Similar to Immigrants from Micronesia by Wage/Income Gap
In terms of wage/income gap, the demographic groups most similar to Immigrants from Micronesia are Kenyan (24.5%, a difference of 0.020%), Immigrants from Afghanistan (24.4%, a difference of 0.030%), Alaska Native (24.4%, a difference of 0.090%), Cree (24.5%, a difference of 0.090%), and Immigrants from Kenya (24.4%, a difference of 0.26%).
| Demographics | Rating | Rank | Wage/Income Gap |
| Soviet Union | 97.6 /100 | #111 | Exceptional 24.2% |
| Immigrants | Colombia | 97.0 /100 | #112 | Exceptional 24.3% |
| Sioux | 96.9 /100 | #113 | Exceptional 24.3% |
| Panamanians | 96.5 /100 | #114 | Exceptional 24.4% |
| Immigrants | Kenya | 96.4 /100 | #115 | Exceptional 24.4% |
| Alaska Natives | 96.0 /100 | #116 | Exceptional 24.4% |
| Immigrants | Afghanistan | 95.9 /100 | #117 | Exceptional 24.4% |
| Immigrants | Micronesia | 95.8 /100 | #118 | Exceptional 24.4% |
| Kenyans | 95.8 /100 | #119 | Exceptional 24.5% |
| Cree | 95.6 /100 | #120 | Exceptional 24.5% |
| Immigrants | Thailand | 94.9 /100 | #121 | Exceptional 24.5% |
| Apache | 94.8 /100 | #122 | Exceptional 24.5% |
| Natives/Alaskans | 94.6 /100 | #123 | Exceptional 24.6% |
| Immigrants | South America | 93.9 /100 | #124 | Exceptional 24.6% |
| Spanish Americans | 93.8 /100 | #125 | Exceptional 24.6% |
Demographics Similar to Immigrants from Taiwan by Wage/Income Gap
In terms of wage/income gap, the demographic groups most similar to Immigrants from Taiwan are English (29.5%, a difference of 0.010%), Swedish (29.4%, a difference of 0.13%), European (29.4%, a difference of 0.27%), Immigrants from South Central Asia (29.3%, a difference of 0.46%), and Dutch (29.6%, a difference of 0.59%).
| Demographics | Rating | Rank | Wage/Income Gap |
| Scandinavians | 0.0 /100 | #328 | Tragic 29.1% |
| Scottish | 0.0 /100 | #329 | Tragic 29.1% |
| Germans | 0.0 /100 | #330 | Tragic 29.2% |
| Czechs | 0.0 /100 | #331 | Tragic 29.2% |
| Immigrants | South Central Asia | 0.0 /100 | #332 | Tragic 29.3% |
| Europeans | 0.0 /100 | #333 | Tragic 29.4% |
| Swedes | 0.0 /100 | #334 | Tragic 29.4% |
| Immigrants | Taiwan | 0.0 /100 | #335 | Tragic 29.5% |
| English | 0.0 /100 | #336 | Tragic 29.5% |
| Dutch | 0.0 /100 | #337 | Tragic 29.6% |
| Filipinos | 0.0 /100 | #338 | Tragic 29.7% |
| Iranians | 0.0 /100 | #339 | Tragic 29.7% |
| Swiss | 0.0 /100 | #340 | Tragic 30.0% |
| Thais | 0.0 /100 | #341 | Tragic 30.5% |
| Pennsylvania Germans | 0.0 /100 | #342 | Tragic 30.7% |