Immigrants from Micronesia vs Colombian Wage/Income Gap
COMPARE
Immigrants from Micronesia
Colombian
Wage/Income Gap
Wage/Income Gap Comparison
Immigrants from Micronesia
Colombians
24.4%
WAGE/INCOME GAP
95.8/ 100
METRIC RATING
118th/ 347
METRIC RANK
24.7%
WAGE/INCOME GAP
92.4/ 100
METRIC RATING
133rd/ 347
METRIC RANK
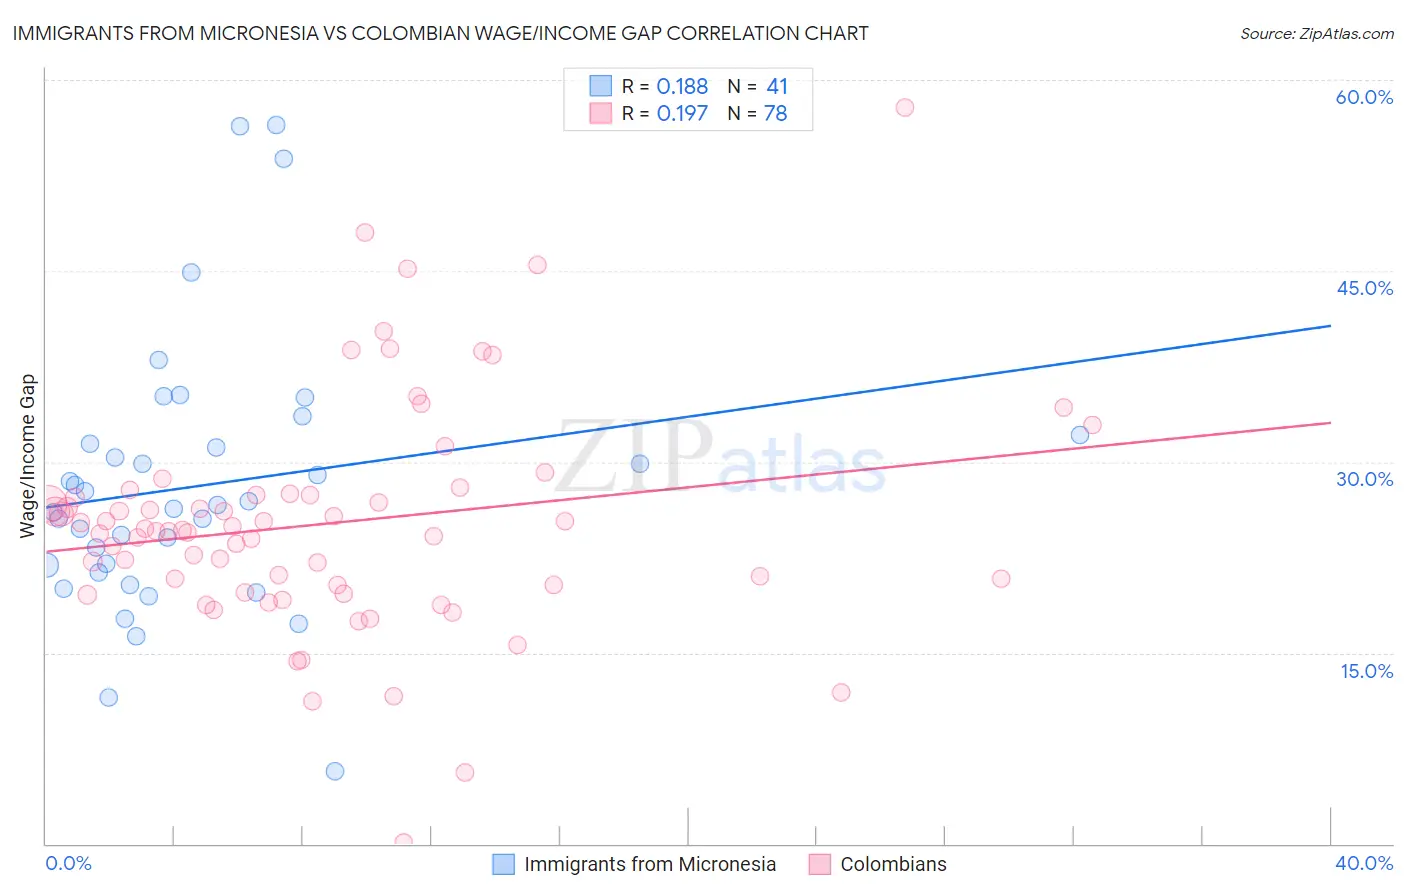
Immigrants from Micronesia vs Colombian Wage/Income Gap Correlation Chart
The statistical analysis conducted on geographies consisting of 61,599,093 people shows a poor positive correlation between the proportion of Immigrants from Micronesia and wage/income gap percentage in the United States with a correlation coefficient (R) of 0.188 and weighted average of 24.4%. Similarly, the statistical analysis conducted on geographies consisting of 419,429,082 people shows a poor positive correlation between the proportion of Colombians and wage/income gap percentage in the United States with a correlation coefficient (R) of 0.197 and weighted average of 24.7%, a difference of 1.1%.
Wage/Income Gap Correlation Summary
| Measurement | Immigrants from Micronesia | Colombian |
| Minimum | 5.7% | 0.074% |
| Maximum | 56.5% | 57.8% |
| Range | 50.8% | 57.8% |
| Mean | 28.1% | 25.2% |
| Median | 26.6% | 24.6% |
| Interquartile 25% (IQ1) | 21.6% | 20.3% |
| Interquartile 75% (IQ3) | 31.8% | 27.4% |
| Interquartile Range (IQR) | 10.1% | 7.1% |
| Standard Deviation (Sample) | 10.6% | 9.1% |
| Standard Deviation (Population) | 10.5% | 9.0% |
Demographics Similar to Immigrants from Micronesia and Colombians by Wage/Income Gap
In terms of wage/income gap, the demographic groups most similar to Immigrants from Micronesia are Kenyan (24.5%, a difference of 0.020%), Immigrants from Afghanistan (24.4%, a difference of 0.030%), Alaska Native (24.4%, a difference of 0.090%), Cree (24.5%, a difference of 0.090%), and Immigrants from Kenya (24.4%, a difference of 0.26%). Similarly, the demographic groups most similar to Colombians are Immigrants from Costa Rica (24.7%, a difference of 0.0%), Mexican American Indian (24.7%, a difference of 0.030%), South American Indian (24.7%, a difference of 0.090%), Immigrants from Philippines (24.7%, a difference of 0.15%), and Alsatian (24.7%, a difference of 0.22%).
| Demographics | Rating | Rank | Wage/Income Gap |
| Immigrants | Kenya | 96.4 /100 | #115 | Exceptional 24.4% |
| Alaska Natives | 96.0 /100 | #116 | Exceptional 24.4% |
| Immigrants | Afghanistan | 95.9 /100 | #117 | Exceptional 24.4% |
| Immigrants | Micronesia | 95.8 /100 | #118 | Exceptional 24.4% |
| Kenyans | 95.8 /100 | #119 | Exceptional 24.5% |
| Cree | 95.6 /100 | #120 | Exceptional 24.5% |
| Immigrants | Thailand | 94.9 /100 | #121 | Exceptional 24.5% |
| Apache | 94.8 /100 | #122 | Exceptional 24.5% |
| Natives/Alaskans | 94.6 /100 | #123 | Exceptional 24.6% |
| Immigrants | South America | 93.9 /100 | #124 | Exceptional 24.6% |
| Spanish Americans | 93.8 /100 | #125 | Exceptional 24.6% |
| Immigrants | Uruguay | 93.8 /100 | #126 | Exceptional 24.6% |
| German Russians | 93.7 /100 | #127 | Exceptional 24.6% |
| Immigrants | Central America | 93.5 /100 | #128 | Exceptional 24.6% |
| Yup'ik | 93.3 /100 | #129 | Exceptional 24.7% |
| Alsatians | 93.2 /100 | #130 | Exceptional 24.7% |
| Immigrants | Philippines | 93.0 /100 | #131 | Exceptional 24.7% |
| Immigrants | Costa Rica | 92.4 /100 | #132 | Exceptional 24.7% |
| Colombians | 92.4 /100 | #133 | Exceptional 24.7% |
| Mexican American Indians | 92.2 /100 | #134 | Exceptional 24.7% |
| South American Indians | 92.0 /100 | #135 | Exceptional 24.7% |