Immigrants from Japan vs Kiowa Wage/Income Gap
COMPARE
Immigrants from Japan
Kiowa
Wage/Income Gap
Wage/Income Gap Comparison
Immigrants from Japan
Kiowa
27.9%
WAGE/INCOME GAP
0.7/ 100
METRIC RATING
275th/ 347
METRIC RANK
23.6%
WAGE/INCOME GAP
99.4/ 100
METRIC RATING
96th/ 347
METRIC RANK
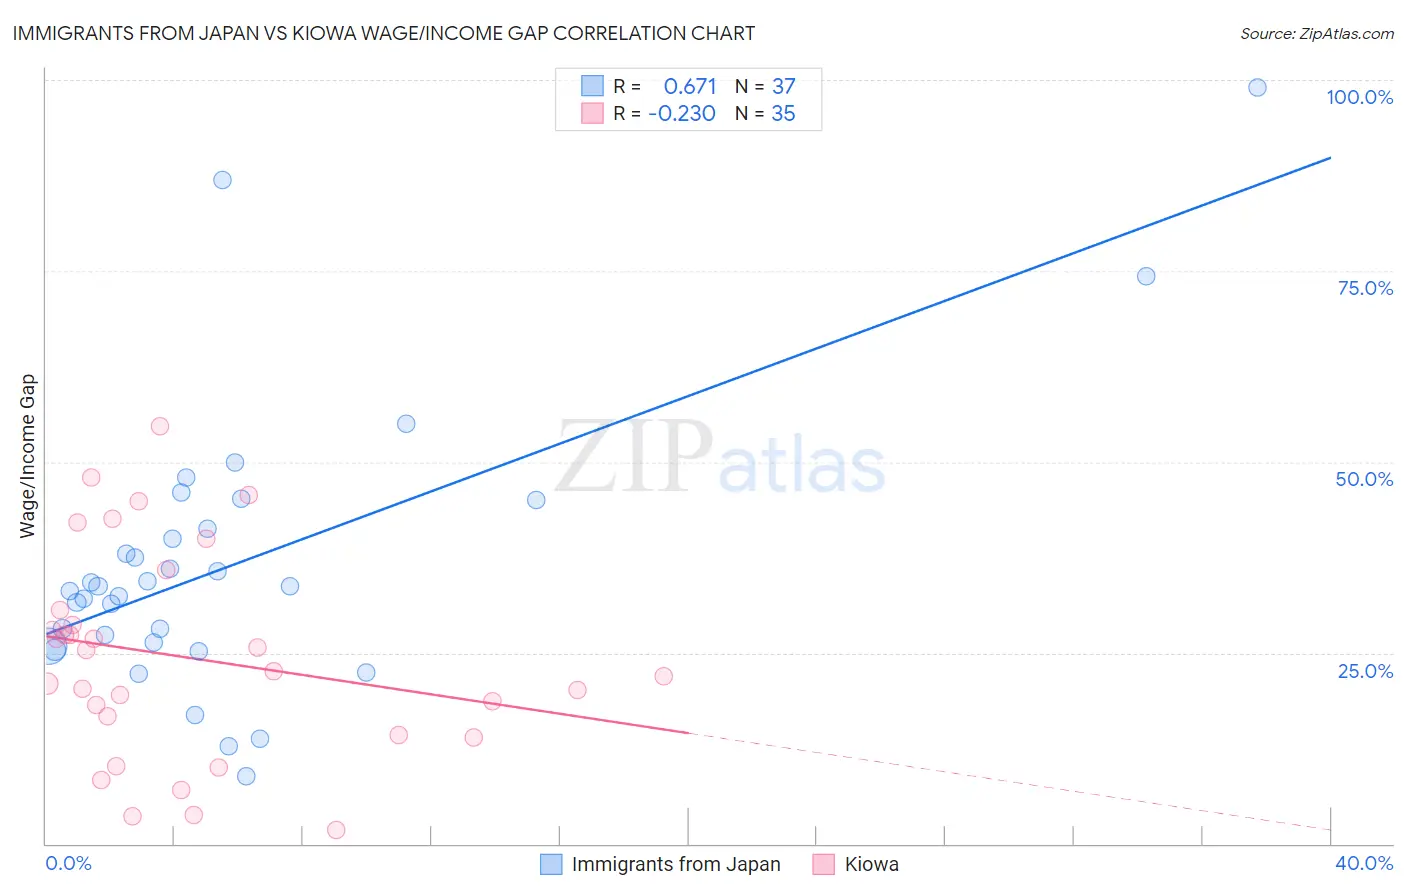
Immigrants from Japan vs Kiowa Wage/Income Gap Correlation Chart
The statistical analysis conducted on geographies consisting of 339,998,398 people shows a significant positive correlation between the proportion of Immigrants from Japan and wage/income gap percentage in the United States with a correlation coefficient (R) of 0.671 and weighted average of 27.9%. Similarly, the statistical analysis conducted on geographies consisting of 56,090,422 people shows a weak negative correlation between the proportion of Kiowa and wage/income gap percentage in the United States with a correlation coefficient (R) of -0.230 and weighted average of 23.6%, a difference of 18.0%.
Wage/Income Gap Correlation Summary
| Measurement | Immigrants from Japan | Kiowa |
| Minimum | 8.9% | 1.7% |
| Maximum | 99.0% | 54.7% |
| Range | 90.1% | 53.0% |
| Mean | 36.7% | 24.3% |
| Median | 33.6% | 22.6% |
| Interquartile 25% (IQ1) | 26.1% | 14.2% |
| Interquartile 75% (IQ3) | 43.1% | 30.6% |
| Interquartile Range (IQR) | 17.0% | 16.4% |
| Standard Deviation (Sample) | 18.4% | 13.5% |
| Standard Deviation (Population) | 18.2% | 13.3% |
Similar Demographics by Wage/Income Gap
Demographics Similar to Immigrants from Japan by Wage/Income Gap
In terms of wage/income gap, the demographic groups most similar to Immigrants from Japan are Lebanese (27.9%, a difference of 0.030%), Latvian (27.9%, a difference of 0.030%), American (27.8%, a difference of 0.080%), Immigrants from England (27.9%, a difference of 0.11%), and Bulgarian (27.8%, a difference of 0.12%).
| Demographics | Rating | Rank | Wage/Income Gap |
| New Zealanders | 1.0 /100 | #268 | Tragic 27.7% |
| Potawatomi | 0.9 /100 | #269 | Tragic 27.7% |
| Immigrants | Western Europe | 0.9 /100 | #270 | Tragic 27.8% |
| Ute | 0.8 /100 | #271 | Tragic 27.8% |
| Immigrants | Korea | 0.8 /100 | #272 | Tragic 27.8% |
| Bulgarians | 0.7 /100 | #273 | Tragic 27.8% |
| Americans | 0.7 /100 | #274 | Tragic 27.8% |
| Immigrants | Japan | 0.7 /100 | #275 | Tragic 27.9% |
| Lebanese | 0.7 /100 | #276 | Tragic 27.9% |
| Latvians | 0.7 /100 | #277 | Tragic 27.9% |
| Immigrants | England | 0.6 /100 | #278 | Tragic 27.9% |
| Romanians | 0.5 /100 | #279 | Tragic 28.0% |
| Russians | 0.5 /100 | #280 | Tragic 28.0% |
| Burmese | 0.5 /100 | #281 | Tragic 28.0% |
| South Africans | 0.5 /100 | #282 | Tragic 28.0% |
Demographics Similar to Kiowa by Wage/Income Gap
In terms of wage/income gap, the demographic groups most similar to Kiowa are Immigrants from Sudan (23.6%, a difference of 0.090%), Cape Verdean (23.6%, a difference of 0.12%), Honduran (23.6%, a difference of 0.15%), Immigrants from Cabo Verde (23.6%, a difference of 0.24%), and Immigrants from Latin America (23.7%, a difference of 0.48%).
| Demographics | Rating | Rank | Wage/Income Gap |
| Marshallese | 99.6 /100 | #89 | Exceptional 23.4% |
| Nicaraguans | 99.6 /100 | #90 | Exceptional 23.4% |
| Arapaho | 99.6 /100 | #91 | Exceptional 23.5% |
| Immigrants | Honduras | 99.5 /100 | #92 | Exceptional 23.5% |
| Immigrants | Cabo Verde | 99.5 /100 | #93 | Exceptional 23.6% |
| Hondurans | 99.5 /100 | #94 | Exceptional 23.6% |
| Cape Verdeans | 99.4 /100 | #95 | Exceptional 23.6% |
| Kiowa | 99.4 /100 | #96 | Exceptional 23.6% |
| Immigrants | Sudan | 99.4 /100 | #97 | Exceptional 23.6% |
| Immigrants | Latin America | 99.2 /100 | #98 | Exceptional 23.7% |
| Aleuts | 99.2 /100 | #99 | Exceptional 23.7% |
| Yakama | 99.2 /100 | #100 | Exceptional 23.7% |
| Japanese | 99.1 /100 | #101 | Exceptional 23.8% |
| Immigrants | Laos | 99.0 /100 | #102 | Exceptional 23.8% |
| Tsimshian | 98.9 /100 | #103 | Exceptional 23.9% |