Immigrants from Japan vs Kiowa Child Poverty Among Girls Under 16
COMPARE
Immigrants from Japan
Kiowa
Child Poverty Among Girls Under 16
Child Poverty Among Girls Under 16 Comparison
Immigrants from Japan
Kiowa
13.3%
CHILD POVERTY AMONG GIRLS UNDER 16
99.9/ 100
METRIC RATING
20th/ 347
METRIC RANK
23.7%
CHILD POVERTY AMONG GIRLS UNDER 16
0.0/ 100
METRIC RATING
329th/ 347
METRIC RANK
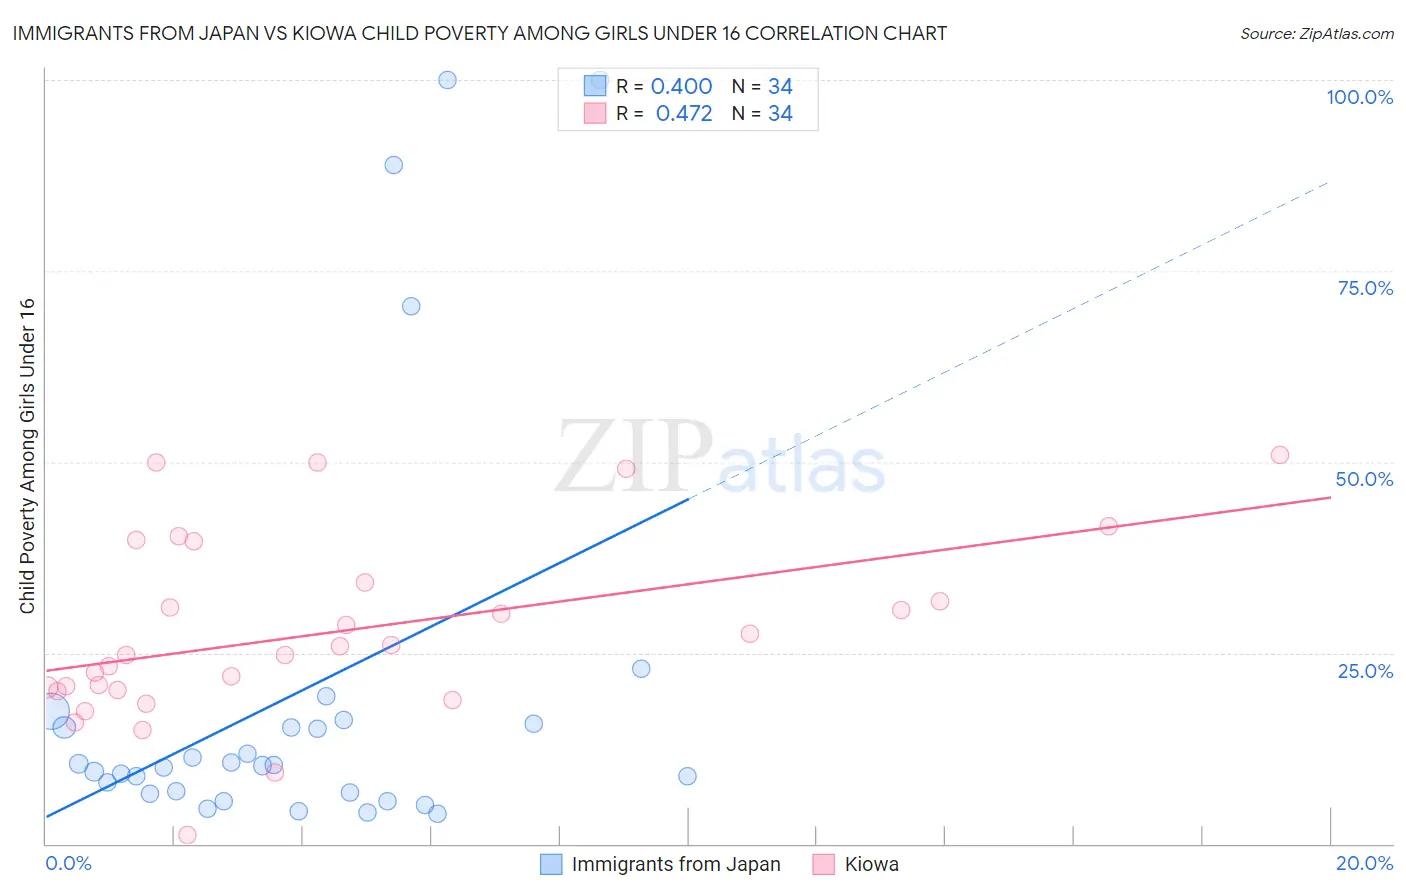
Immigrants from Japan vs Kiowa Child Poverty Among Girls Under 16 Correlation Chart
The statistical analysis conducted on geographies consisting of 334,926,673 people shows a moderate positive correlation between the proportion of Immigrants from Japan and poverty level among girls under the age of 16 in the United States with a correlation coefficient (R) of 0.400 and weighted average of 13.3%. Similarly, the statistical analysis conducted on geographies consisting of 55,981,337 people shows a moderate positive correlation between the proportion of Kiowa and poverty level among girls under the age of 16 in the United States with a correlation coefficient (R) of 0.472 and weighted average of 23.7%, a difference of 78.4%.
Child Poverty Among Girls Under 16 Correlation Summary
| Measurement | Immigrants from Japan | Kiowa |
| Minimum | 3.9% | 1.2% |
| Maximum | 100.0% | 50.8% |
| Range | 96.1% | 49.7% |
| Mean | 19.7% | 27.7% |
| Median | 10.3% | 25.3% |
| Interquartile 25% (IQ1) | 6.7% | 20.1% |
| Interquartile 75% (IQ3) | 15.7% | 34.2% |
| Interquartile Range (IQR) | 9.1% | 14.1% |
| Standard Deviation (Sample) | 26.7% | 11.9% |
| Standard Deviation (Population) | 26.4% | 11.8% |
Similar Demographics by Child Poverty Among Girls Under 16
Demographics Similar to Immigrants from Japan by Child Poverty Among Girls Under 16
In terms of child poverty among girls under 16, the demographic groups most similar to Immigrants from Japan are Assyrian/Chaldean/Syriac (13.3%, a difference of 0.12%), Indian (Asian) (13.3%, a difference of 0.32%), Norwegian (13.3%, a difference of 0.49%), Immigrants from Eastern Asia (13.4%, a difference of 0.58%), and Cypriot (13.2%, a difference of 0.66%).
| Demographics | Rating | Rank | Child Poverty Among Girls Under 16 |
| Immigrants | Ireland | 99.9 /100 | #13 | Exceptional 12.9% |
| Burmese | 99.9 /100 | #14 | Exceptional 13.0% |
| Okinawans | 99.9 /100 | #15 | Exceptional 13.0% |
| Immigrants | Lithuania | 99.9 /100 | #16 | Exceptional 13.1% |
| Bulgarians | 99.9 /100 | #17 | Exceptional 13.1% |
| Immigrants | Korea | 99.9 /100 | #18 | Exceptional 13.1% |
| Cypriots | 99.9 /100 | #19 | Exceptional 13.2% |
| Immigrants | Japan | 99.9 /100 | #20 | Exceptional 13.3% |
| Assyrians/Chaldeans/Syriacs | 99.9 /100 | #21 | Exceptional 13.3% |
| Indians (Asian) | 99.9 /100 | #22 | Exceptional 13.3% |
| Norwegians | 99.9 /100 | #23 | Exceptional 13.3% |
| Immigrants | Eastern Asia | 99.9 /100 | #24 | Exceptional 13.4% |
| Immigrants | China | 99.8 /100 | #25 | Exceptional 13.4% |
| Eastern Europeans | 99.8 /100 | #26 | Exceptional 13.5% |
| Latvians | 99.8 /100 | #27 | Exceptional 13.5% |
Demographics Similar to Kiowa by Child Poverty Among Girls Under 16
In terms of child poverty among girls under 16, the demographic groups most similar to Kiowa are Dominican (23.7%, a difference of 0.12%), Immigrants from Dominican Republic (23.8%, a difference of 0.54%), Apache (23.8%, a difference of 0.58%), Native/Alaskan (24.0%, a difference of 1.5%), and Central American Indian (22.8%, a difference of 3.9%).
| Demographics | Rating | Rank | Child Poverty Among Girls Under 16 |
| Yakama | 0.0 /100 | #322 | Tragic 22.6% |
| Cajuns | 0.0 /100 | #323 | Tragic 22.6% |
| Paiute | 0.0 /100 | #324 | Tragic 22.6% |
| Immigrants | Congo | 0.0 /100 | #325 | Tragic 22.7% |
| Immigrants | Honduras | 0.0 /100 | #326 | Tragic 22.8% |
| Central American Indians | 0.0 /100 | #327 | Tragic 22.8% |
| Dominicans | 0.0 /100 | #328 | Tragic 23.7% |
| Kiowa | 0.0 /100 | #329 | Tragic 23.7% |
| Immigrants | Dominican Republic | 0.0 /100 | #330 | Tragic 23.8% |
| Apache | 0.0 /100 | #331 | Tragic 23.8% |
| Natives/Alaskans | 0.0 /100 | #332 | Tragic 24.0% |
| Blacks/African Americans | 0.0 /100 | #333 | Tragic 24.7% |
| Menominee | 0.0 /100 | #334 | Tragic 25.0% |
| Pueblo | 0.0 /100 | #335 | Tragic 25.2% |
| Sioux | 0.0 /100 | #336 | Tragic 25.6% |