Immigrants from Ireland vs Arapaho Wage/Income Gap
COMPARE
Immigrants from Ireland
Arapaho
Wage/Income Gap
Wage/Income Gap Comparison
Immigrants from Ireland
Arapaho
26.9%
WAGE/INCOME GAP
6.5/ 100
METRIC RATING
225th/ 347
METRIC RANK
23.5%
WAGE/INCOME GAP
99.6/ 100
METRIC RATING
91st/ 347
METRIC RANK
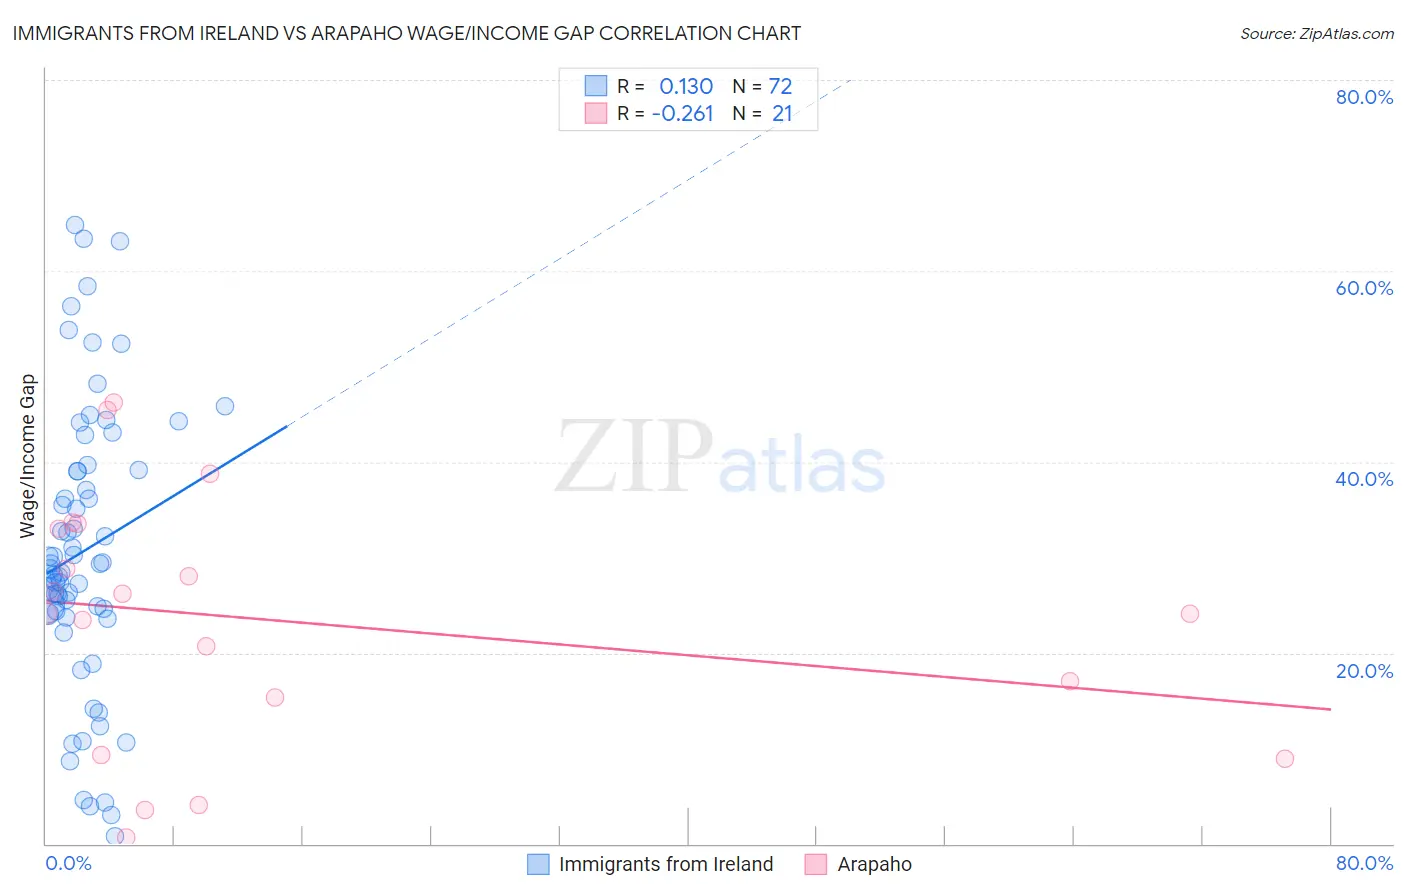
Immigrants from Ireland vs Arapaho Wage/Income Gap Correlation Chart
The statistical analysis conducted on geographies consisting of 240,648,887 people shows a poor positive correlation between the proportion of Immigrants from Ireland and wage/income gap percentage in the United States with a correlation coefficient (R) of 0.130 and weighted average of 26.9%. Similarly, the statistical analysis conducted on geographies consisting of 29,769,339 people shows a weak negative correlation between the proportion of Arapaho and wage/income gap percentage in the United States with a correlation coefficient (R) of -0.261 and weighted average of 23.5%, a difference of 14.6%.
Wage/Income Gap Correlation Summary
| Measurement | Immigrants from Ireland | Arapaho |
| Minimum | 0.77% | 0.71% |
| Maximum | 64.9% | 46.3% |
| Range | 64.1% | 45.6% |
| Mean | 30.6% | 23.4% |
| Median | 29.0% | 24.1% |
| Interquartile 25% (IQ1) | 24.2% | 12.3% |
| Interquartile 75% (IQ3) | 39.1% | 33.3% |
| Interquartile Range (IQR) | 14.9% | 20.9% |
| Standard Deviation (Sample) | 14.7% | 13.1% |
| Standard Deviation (Population) | 14.6% | 12.8% |
Similar Demographics by Wage/Income Gap
Demographics Similar to Immigrants from Ireland by Wage/Income Gap
In terms of wage/income gap, the demographic groups most similar to Immigrants from Ireland are Immigrants from Argentina (26.8%, a difference of 0.17%), Asian (26.9%, a difference of 0.17%), Spaniard (27.0%, a difference of 0.24%), Immigrants from Turkey (27.0%, a difference of 0.25%), and Immigrants from Asia (27.0%, a difference of 0.28%).
| Demographics | Rating | Rank | Wage/Income Gap |
| Immigrants | Saudi Arabia | 9.1 /100 | #218 | Tragic 26.7% |
| Immigrants | Poland | 8.9 /100 | #219 | Tragic 26.7% |
| Immigrants | Latvia | 8.9 /100 | #220 | Tragic 26.7% |
| Immigrants | Spain | 8.5 /100 | #221 | Tragic 26.8% |
| Bolivians | 8.3 /100 | #222 | Tragic 26.8% |
| Jordanians | 8.0 /100 | #223 | Tragic 26.8% |
| Immigrants | Argentina | 7.2 /100 | #224 | Tragic 26.8% |
| Immigrants | Ireland | 6.5 /100 | #225 | Tragic 26.9% |
| Asians | 5.9 /100 | #226 | Tragic 26.9% |
| Spaniards | 5.6 /100 | #227 | Tragic 27.0% |
| Immigrants | Turkey | 5.6 /100 | #228 | Tragic 27.0% |
| Immigrants | Asia | 5.5 /100 | #229 | Tragic 27.0% |
| Ottawa | 5.3 /100 | #230 | Tragic 27.0% |
| Bhutanese | 5.3 /100 | #231 | Tragic 27.0% |
| Argentineans | 5.2 /100 | #232 | Tragic 27.0% |
Demographics Similar to Arapaho by Wage/Income Gap
In terms of wage/income gap, the demographic groups most similar to Arapaho are Nicaraguan (23.4%, a difference of 0.14%), Marshallese (23.4%, a difference of 0.15%), Immigrants from Honduras (23.5%, a difference of 0.15%), Immigrants from Panama (23.4%, a difference of 0.24%), and Immigrants from Cabo Verde (23.6%, a difference of 0.39%).
| Demographics | Rating | Rank | Wage/Income Gap |
| Cubans | 99.7 /100 | #84 | Exceptional 23.3% |
| Immigrants | Cambodia | 99.7 /100 | #85 | Exceptional 23.3% |
| Cheyenne | 99.7 /100 | #86 | Exceptional 23.3% |
| Yuman | 99.7 /100 | #87 | Exceptional 23.3% |
| Immigrants | Panama | 99.6 /100 | #88 | Exceptional 23.4% |
| Marshallese | 99.6 /100 | #89 | Exceptional 23.4% |
| Nicaraguans | 99.6 /100 | #90 | Exceptional 23.4% |
| Arapaho | 99.6 /100 | #91 | Exceptional 23.5% |
| Immigrants | Honduras | 99.5 /100 | #92 | Exceptional 23.5% |
| Immigrants | Cabo Verde | 99.5 /100 | #93 | Exceptional 23.6% |
| Hondurans | 99.5 /100 | #94 | Exceptional 23.6% |
| Cape Verdeans | 99.4 /100 | #95 | Exceptional 23.6% |
| Kiowa | 99.4 /100 | #96 | Exceptional 23.6% |
| Immigrants | Sudan | 99.4 /100 | #97 | Exceptional 23.6% |
| Immigrants | Latin America | 99.2 /100 | #98 | Exceptional 23.7% |