Immigrants from Greece vs Delaware Wage/Income Gap
COMPARE
Immigrants from Greece
Delaware
Wage/Income Gap
Wage/Income Gap Comparison
Immigrants from Greece
Delaware
25.7%
WAGE/INCOME GAP
56.6/ 100
METRIC RATING
171st/ 347
METRIC RANK
26.3%
WAGE/INCOME GAP
20.9/ 100
METRIC RATING
200th/ 347
METRIC RANK
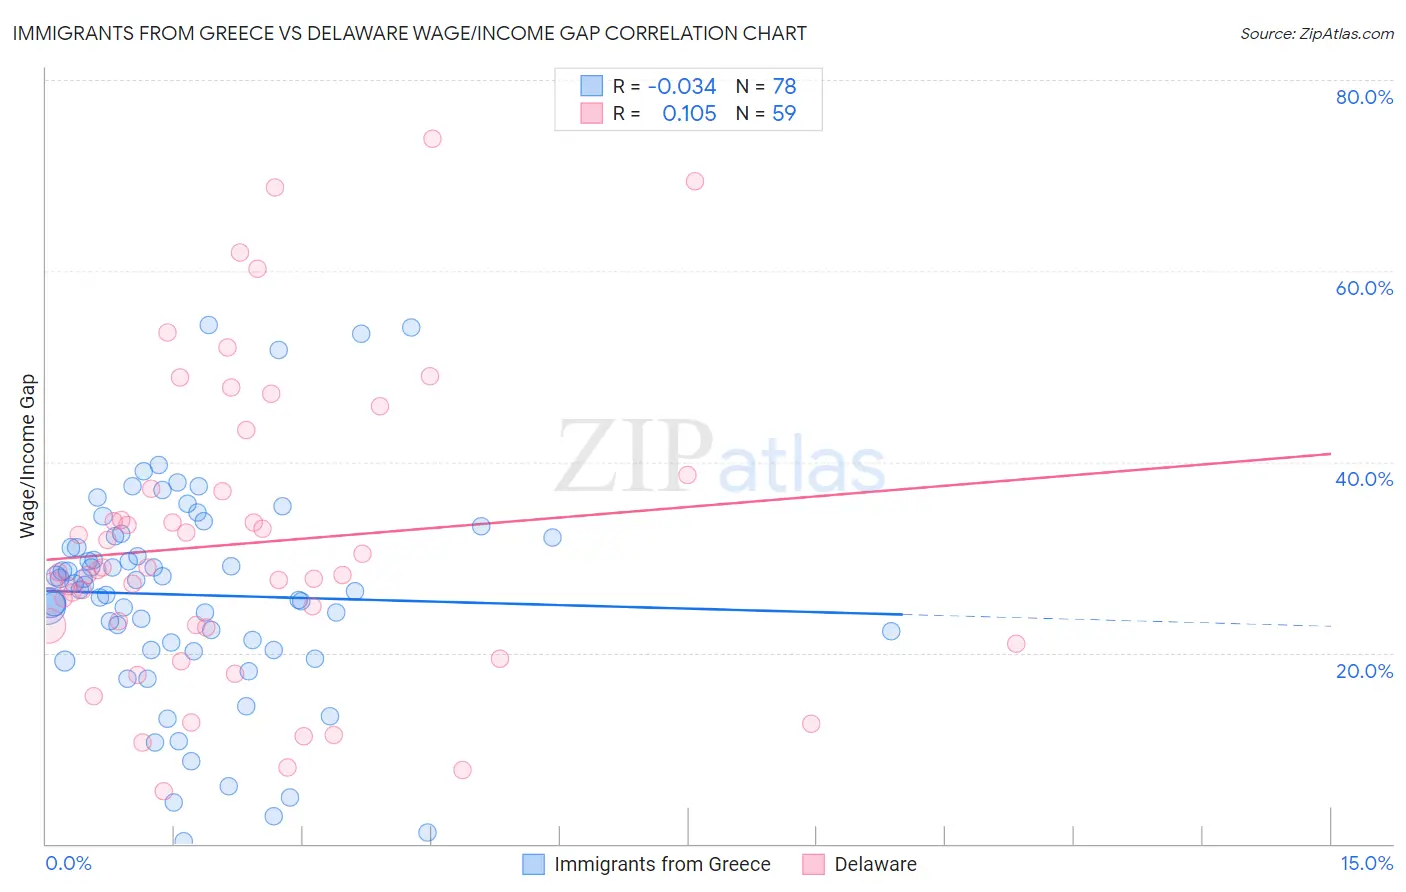
Immigrants from Greece vs Delaware Wage/Income Gap Correlation Chart
The statistical analysis conducted on geographies consisting of 216,813,156 people shows no correlation between the proportion of Immigrants from Greece and wage/income gap percentage in the United States with a correlation coefficient (R) of -0.034 and weighted average of 25.7%. Similarly, the statistical analysis conducted on geographies consisting of 96,192,604 people shows a poor positive correlation between the proportion of Delaware and wage/income gap percentage in the United States with a correlation coefficient (R) of 0.105 and weighted average of 26.3%, a difference of 2.6%.
Wage/Income Gap Correlation Summary
| Measurement | Immigrants from Greece | Delaware |
| Minimum | 0.24% | 5.5% |
| Maximum | 54.3% | 73.9% |
| Range | 54.0% | 68.4% |
| Mean | 26.1% | 31.5% |
| Median | 26.8% | 28.4% |
| Interquartile 25% (IQ1) | 20.3% | 22.7% |
| Interquartile 75% (IQ3) | 32.0% | 37.2% |
| Interquartile Range (IQR) | 11.7% | 14.5% |
| Standard Deviation (Sample) | 11.2% | 15.7% |
| Standard Deviation (Population) | 11.1% | 15.5% |
Similar Demographics by Wage/Income Gap
Demographics Similar to Immigrants from Greece by Wage/Income Gap
In terms of wage/income gap, the demographic groups most similar to Immigrants from Greece are Immigrants from Oceania (25.6%, a difference of 0.060%), Immigrants from Chile (25.7%, a difference of 0.22%), Peruvian (25.6%, a difference of 0.23%), Immigrants from Belarus (25.7%, a difference of 0.24%), and Seminole (25.6%, a difference of 0.41%).
| Demographics | Rating | Rank | Wage/Income Gap |
| Koreans | 68.6 /100 | #164 | Good 25.4% |
| Immigrants | Hong Kong | 64.0 /100 | #165 | Good 25.5% |
| Immigrants | Ukraine | 63.8 /100 | #166 | Good 25.5% |
| Paiute | 62.9 /100 | #167 | Good 25.5% |
| Seminole | 62.6 /100 | #168 | Good 25.6% |
| Peruvians | 60.1 /100 | #169 | Good 25.6% |
| Immigrants | Oceania | 57.5 /100 | #170 | Average 25.6% |
| Immigrants | Greece | 56.6 /100 | #171 | Average 25.7% |
| Immigrants | Chile | 53.2 /100 | #172 | Average 25.7% |
| Immigrants | Belarus | 52.9 /100 | #173 | Average 25.7% |
| Alaskan Athabascans | 50.0 /100 | #174 | Average 25.8% |
| Sri Lankans | 47.0 /100 | #175 | Average 25.8% |
| Paraguayans | 46.7 /100 | #176 | Average 25.8% |
| Cambodians | 45.1 /100 | #177 | Average 25.8% |
| Chinese | 42.0 /100 | #178 | Average 25.9% |
Demographics Similar to Delaware by Wage/Income Gap
In terms of wage/income gap, the demographic groups most similar to Delaware are Dutch West Indian (26.3%, a difference of 0.010%), Venezuelan (26.3%, a difference of 0.050%), Zimbabwean (26.3%, a difference of 0.070%), Immigrants from Western Asia (26.3%, a difference of 0.080%), and Immigrants from Malaysia (26.3%, a difference of 0.12%).
| Demographics | Rating | Rank | Wage/Income Gap |
| Immigrants | Jordan | 22.4 /100 | #193 | Fair 26.3% |
| Chileans | 22.3 /100 | #194 | Fair 26.3% |
| Immigrants | Malaysia | 22.2 /100 | #195 | Fair 26.3% |
| Immigrants | Western Asia | 21.7 /100 | #196 | Fair 26.3% |
| Zimbabweans | 21.6 /100 | #197 | Fair 26.3% |
| Venezuelans | 21.5 /100 | #198 | Fair 26.3% |
| Dutch West Indians | 21.0 /100 | #199 | Fair 26.3% |
| Delaware | 20.9 /100 | #200 | Fair 26.3% |
| Immigrants | Syria | 19.3 /100 | #201 | Poor 26.4% |
| Laotians | 19.2 /100 | #202 | Poor 26.4% |
| Immigrants | Eastern Europe | 19.2 /100 | #203 | Poor 26.4% |
| Immigrants | Russia | 19.0 /100 | #204 | Poor 26.4% |
| Immigrants | Southern Europe | 17.3 /100 | #205 | Poor 26.4% |
| Indians (Asian) | 16.5 /100 | #206 | Poor 26.4% |
| Immigrants | Italy | 15.8 /100 | #207 | Poor 26.5% |