Immigrants from Greece vs Bangladeshi Wage/Income Gap
COMPARE
Immigrants from Greece
Bangladeshi
Wage/Income Gap
Wage/Income Gap Comparison
Immigrants from Greece
Bangladeshis
25.7%
WAGE/INCOME GAP
56.6/ 100
METRIC RATING
171st/ 347
METRIC RANK
22.2%
WAGE/INCOME GAP
100.0/ 100
METRIC RATING
53rd/ 347
METRIC RANK
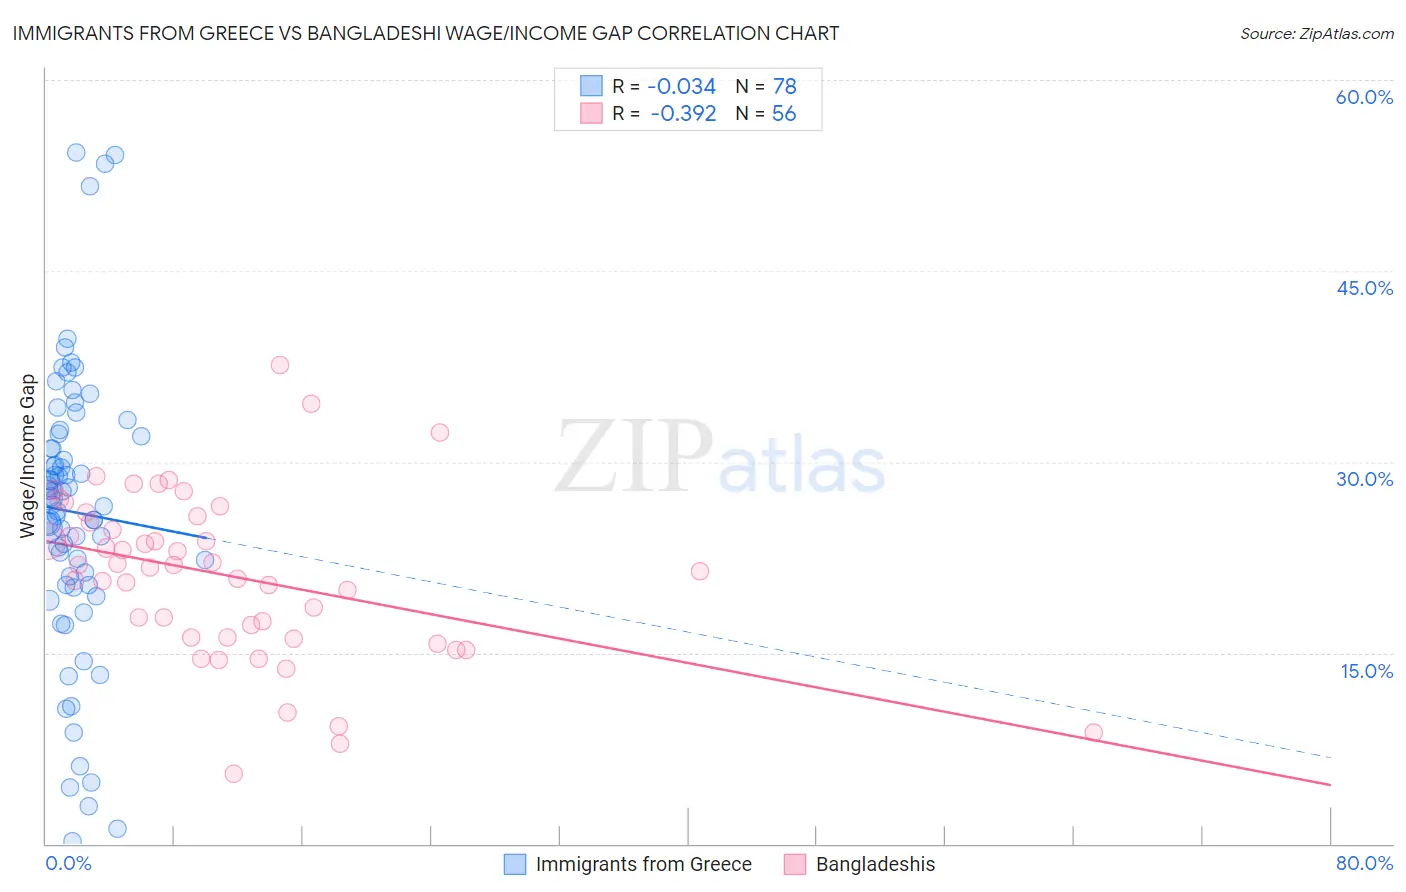
Immigrants from Greece vs Bangladeshi Wage/Income Gap Correlation Chart
The statistical analysis conducted on geographies consisting of 216,813,156 people shows no correlation between the proportion of Immigrants from Greece and wage/income gap percentage in the United States with a correlation coefficient (R) of -0.034 and weighted average of 25.7%. Similarly, the statistical analysis conducted on geographies consisting of 141,421,838 people shows a mild negative correlation between the proportion of Bangladeshis and wage/income gap percentage in the United States with a correlation coefficient (R) of -0.392 and weighted average of 22.2%, a difference of 15.8%.
Wage/Income Gap Correlation Summary
| Measurement | Immigrants from Greece | Bangladeshi |
| Minimum | 0.24% | 5.5% |
| Maximum | 54.3% | 37.6% |
| Range | 54.0% | 32.1% |
| Mean | 26.1% | 21.1% |
| Median | 26.8% | 21.8% |
| Interquartile 25% (IQ1) | 20.3% | 16.2% |
| Interquartile 75% (IQ3) | 32.0% | 25.4% |
| Interquartile Range (IQR) | 11.7% | 9.2% |
| Standard Deviation (Sample) | 11.2% | 6.5% |
| Standard Deviation (Population) | 11.1% | 6.5% |
Similar Demographics by Wage/Income Gap
Demographics Similar to Immigrants from Greece by Wage/Income Gap
In terms of wage/income gap, the demographic groups most similar to Immigrants from Greece are Immigrants from Oceania (25.6%, a difference of 0.060%), Immigrants from Chile (25.7%, a difference of 0.22%), Peruvian (25.6%, a difference of 0.23%), Immigrants from Belarus (25.7%, a difference of 0.24%), and Seminole (25.6%, a difference of 0.41%).
| Demographics | Rating | Rank | Wage/Income Gap |
| Koreans | 68.6 /100 | #164 | Good 25.4% |
| Immigrants | Hong Kong | 64.0 /100 | #165 | Good 25.5% |
| Immigrants | Ukraine | 63.8 /100 | #166 | Good 25.5% |
| Paiute | 62.9 /100 | #167 | Good 25.5% |
| Seminole | 62.6 /100 | #168 | Good 25.6% |
| Peruvians | 60.1 /100 | #169 | Good 25.6% |
| Immigrants | Oceania | 57.5 /100 | #170 | Average 25.6% |
| Immigrants | Greece | 56.6 /100 | #171 | Average 25.7% |
| Immigrants | Chile | 53.2 /100 | #172 | Average 25.7% |
| Immigrants | Belarus | 52.9 /100 | #173 | Average 25.7% |
| Alaskan Athabascans | 50.0 /100 | #174 | Average 25.8% |
| Sri Lankans | 47.0 /100 | #175 | Average 25.8% |
| Paraguayans | 46.7 /100 | #176 | Average 25.8% |
| Cambodians | 45.1 /100 | #177 | Average 25.8% |
| Chinese | 42.0 /100 | #178 | Average 25.9% |
Demographics Similar to Bangladeshis by Wage/Income Gap
In terms of wage/income gap, the demographic groups most similar to Bangladeshis are Immigrants from Cameroon (22.2%, a difference of 0.010%), Tohono O'odham (22.1%, a difference of 0.10%), Nepalese (22.2%, a difference of 0.23%), Immigrants from Western Africa (22.0%, a difference of 0.53%), and Immigrants from Zaire (22.3%, a difference of 0.63%).
| Demographics | Rating | Rank | Wage/Income Gap |
| Immigrants | Ethiopia | 100.0 /100 | #46 | Exceptional 21.6% |
| Immigrants | Congo | 100.0 /100 | #47 | Exceptional 21.7% |
| Blacks/African Americans | 100.0 /100 | #48 | Exceptional 21.7% |
| Ethiopians | 100.0 /100 | #49 | Exceptional 21.8% |
| Immigrants | Western Africa | 100.0 /100 | #50 | Exceptional 22.0% |
| Tohono O'odham | 100.0 /100 | #51 | Exceptional 22.1% |
| Immigrants | Cameroon | 100.0 /100 | #52 | Exceptional 22.2% |
| Bangladeshis | 100.0 /100 | #53 | Exceptional 22.2% |
| Nepalese | 100.0 /100 | #54 | Exceptional 22.2% |
| Immigrants | Zaire | 100.0 /100 | #55 | Exceptional 22.3% |
| Immigrants | Ghana | 100.0 /100 | #56 | Exceptional 22.3% |
| Ghanaians | 100.0 /100 | #57 | Exceptional 22.3% |
| Immigrants | Cuba | 100.0 /100 | #58 | Exceptional 22.4% |
| Navajo | 100.0 /100 | #59 | Exceptional 22.4% |
| Immigrants | Middle Africa | 100.0 /100 | #60 | Exceptional 22.4% |