Immigrants from France vs Immigrants from Central America Wage/Income Gap
COMPARE
Immigrants from France
Immigrants from Central America
Wage/Income Gap
Wage/Income Gap Comparison
Immigrants from France
Immigrants from Central America
27.4%
WAGE/INCOME GAP
2.1/ 100
METRIC RATING
255th/ 347
METRIC RANK
24.6%
WAGE/INCOME GAP
93.5/ 100
METRIC RATING
128th/ 347
METRIC RANK
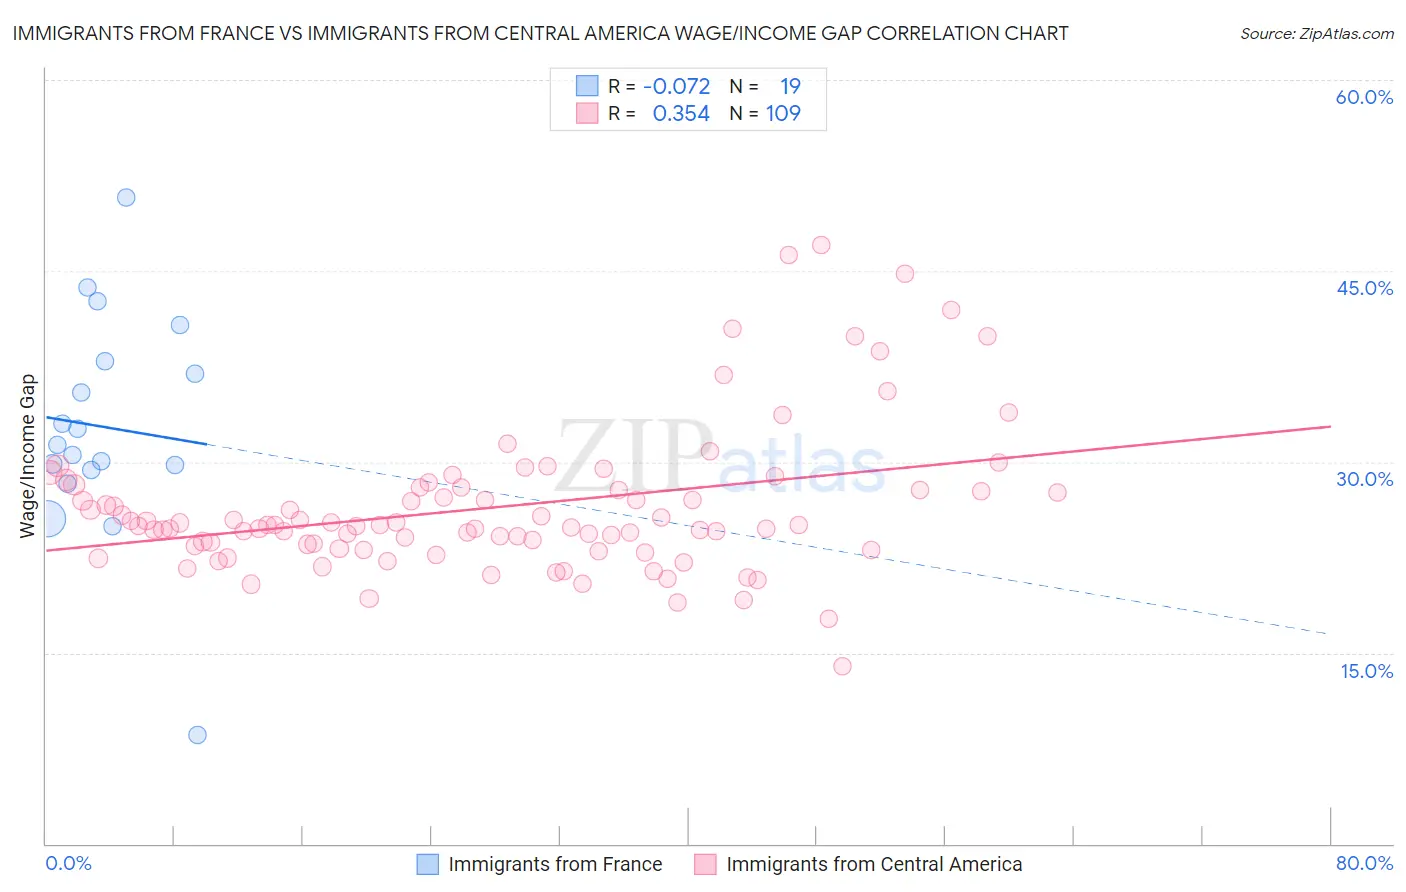
Immigrants from France vs Immigrants from Central America Wage/Income Gap Correlation Chart
The statistical analysis conducted on geographies consisting of 287,766,444 people shows a slight negative correlation between the proportion of Immigrants from France and wage/income gap percentage in the United States with a correlation coefficient (R) of -0.072 and weighted average of 27.4%. Similarly, the statistical analysis conducted on geographies consisting of 534,855,009 people shows a mild positive correlation between the proportion of Immigrants from Central America and wage/income gap percentage in the United States with a correlation coefficient (R) of 0.354 and weighted average of 24.6%, a difference of 11.1%.
Wage/Income Gap Correlation Summary
| Measurement | Immigrants from France | Immigrants from Central America |
| Minimum | 8.5% | 13.9% |
| Maximum | 50.8% | 47.0% |
| Range | 42.2% | 33.1% |
| Mean | 32.7% | 26.4% |
| Median | 31.3% | 25.0% |
| Interquartile 25% (IQ1) | 29.3% | 23.3% |
| Interquartile 75% (IQ3) | 37.9% | 27.9% |
| Interquartile Range (IQR) | 8.6% | 4.6% |
| Standard Deviation (Sample) | 8.9% | 5.7% |
| Standard Deviation (Population) | 8.6% | 5.7% |
Similar Demographics by Wage/Income Gap
Demographics Similar to Immigrants from France by Wage/Income Gap
In terms of wage/income gap, the demographic groups most similar to Immigrants from France are Israeli (27.4%, a difference of 0.010%), Portuguese (27.4%, a difference of 0.090%), Cherokee (27.4%, a difference of 0.10%), Luxembourger (27.4%, a difference of 0.15%), and Slavic (27.4%, a difference of 0.19%).
| Demographics | Rating | Rank | Wage/Income Gap |
| Cypriots | 2.8 /100 | #248 | Tragic 27.3% |
| Carpatho Rusyns | 2.7 /100 | #249 | Tragic 27.3% |
| Immigrants | Czechoslovakia | 2.7 /100 | #250 | Tragic 27.3% |
| Immigrants | Norway | 2.5 /100 | #251 | Tragic 27.3% |
| Ukrainians | 2.4 /100 | #252 | Tragic 27.3% |
| Portuguese | 2.2 /100 | #253 | Tragic 27.4% |
| Israelis | 2.1 /100 | #254 | Tragic 27.4% |
| Immigrants | France | 2.1 /100 | #255 | Tragic 27.4% |
| Cherokee | 1.9 /100 | #256 | Tragic 27.4% |
| Luxembourgers | 1.9 /100 | #257 | Tragic 27.4% |
| Slavs | 1.8 /100 | #258 | Tragic 27.4% |
| Icelanders | 1.8 /100 | #259 | Tragic 27.5% |
| Tongans | 1.7 /100 | #260 | Tragic 27.5% |
| Immigrants | Germany | 1.5 /100 | #261 | Tragic 27.5% |
| Immigrants | Lebanon | 1.5 /100 | #262 | Tragic 27.5% |
Demographics Similar to Immigrants from Central America by Wage/Income Gap
In terms of wage/income gap, the demographic groups most similar to Immigrants from Central America are Yup'ik (24.7%, a difference of 0.050%), Immigrants from Uruguay (24.6%, a difference of 0.070%), German Russian (24.6%, a difference of 0.070%), Alsatian (24.7%, a difference of 0.080%), and Spanish American (24.6%, a difference of 0.090%).
| Demographics | Rating | Rank | Wage/Income Gap |
| Immigrants | Thailand | 94.9 /100 | #121 | Exceptional 24.5% |
| Apache | 94.8 /100 | #122 | Exceptional 24.5% |
| Natives/Alaskans | 94.6 /100 | #123 | Exceptional 24.6% |
| Immigrants | South America | 93.9 /100 | #124 | Exceptional 24.6% |
| Spanish Americans | 93.8 /100 | #125 | Exceptional 24.6% |
| Immigrants | Uruguay | 93.8 /100 | #126 | Exceptional 24.6% |
| German Russians | 93.7 /100 | #127 | Exceptional 24.6% |
| Immigrants | Central America | 93.5 /100 | #128 | Exceptional 24.6% |
| Yup'ik | 93.3 /100 | #129 | Exceptional 24.7% |
| Alsatians | 93.2 /100 | #130 | Exceptional 24.7% |
| Immigrants | Philippines | 93.0 /100 | #131 | Exceptional 24.7% |
| Immigrants | Costa Rica | 92.4 /100 | #132 | Exceptional 24.7% |
| Colombians | 92.4 /100 | #133 | Exceptional 24.7% |
| Mexican American Indians | 92.2 /100 | #134 | Exceptional 24.7% |
| South American Indians | 92.0 /100 | #135 | Exceptional 24.7% |