Immigrants from Fiji vs Yup'ik Median Male Earnings
COMPARE
Immigrants from Fiji
Yup'ik
Median Male Earnings
Median Male Earnings Comparison
Immigrants from Fiji
Yup'ik
$54,958
MEDIAN MALE EARNINGS
61.2/ 100
METRIC RATING
167th/ 347
METRIC RANK
$39,504
MEDIAN MALE EARNINGS
0.0/ 100
METRIC RATING
347th/ 347
METRIC RANK
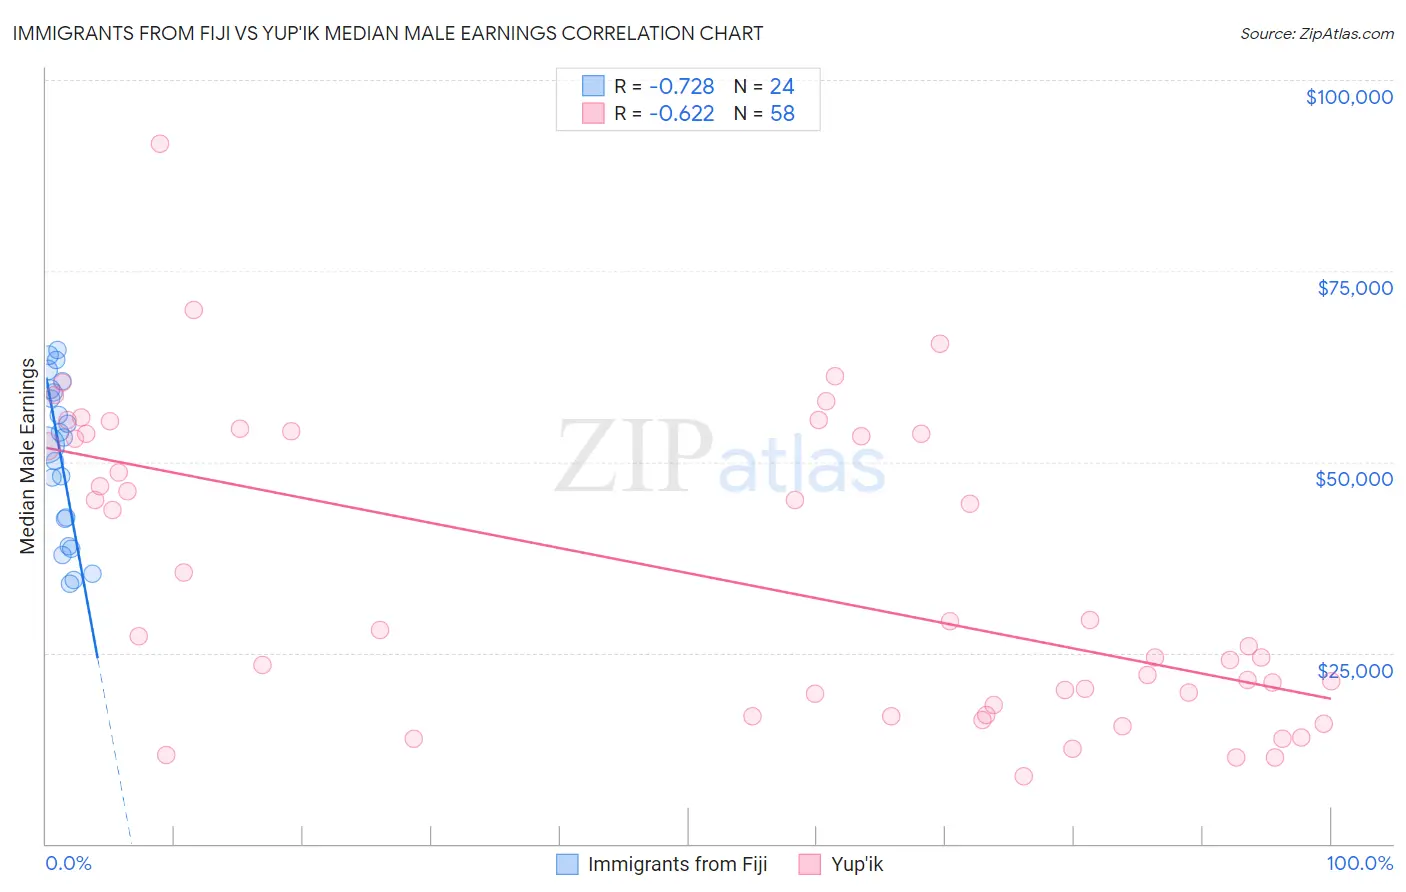
Immigrants from Fiji vs Yup'ik Median Male Earnings Correlation Chart
The statistical analysis conducted on geographies consisting of 93,749,619 people shows a strong negative correlation between the proportion of Immigrants from Fiji and median male earnings in the United States with a correlation coefficient (R) of -0.728 and weighted average of $54,958. Similarly, the statistical analysis conducted on geographies consisting of 39,949,304 people shows a significant negative correlation between the proportion of Yup'ik and median male earnings in the United States with a correlation coefficient (R) of -0.622 and weighted average of $39,504, a difference of 39.1%.
Median Male Earnings Correlation Summary
| Measurement | Immigrants from Fiji | Yup'ik |
| Minimum | $34,054 | $8,859 |
| Maximum | $64,713 | $91,667 |
| Range | $30,659 | $82,808 |
| Mean | $50,520 | $35,016 |
| Median | $52,738 | $27,549 |
| Interquartile 25% (IQ1) | $40,707 | $18,125 |
| Interquartile 75% (IQ3) | $59,322 | $53,694 |
| Interquartile Range (IQR) | $18,615 | $35,569 |
| Standard Deviation (Sample) | $10,211 | $19,492 |
| Standard Deviation (Population) | $9,996 | $19,323 |
Similar Demographics by Median Male Earnings
Demographics Similar to Immigrants from Fiji by Median Male Earnings
In terms of median male earnings, the demographic groups most similar to Immigrants from Fiji are German ($54,974, a difference of 0.030%), Immigrants from Vietnam ($54,913, a difference of 0.080%), Immigrants from Portugal ($55,182, a difference of 0.41%), French Canadian ($54,722, a difference of 0.43%), and Finnish ($54,721, a difference of 0.43%).
| Demographics | Rating | Rank | Median Male Earnings |
| Basques | 70.3 /100 | #160 | Good $55,370 |
| Belgians | 70.1 /100 | #161 | Good $55,361 |
| French | 69.9 /100 | #162 | Good $55,350 |
| Ugandans | 68.6 /100 | #163 | Good $55,290 |
| Immigrants | South Eastern Asia | 67.6 /100 | #164 | Good $55,241 |
| Immigrants | Portugal | 66.3 /100 | #165 | Good $55,182 |
| Germans | 61.6 /100 | #166 | Good $54,974 |
| Immigrants | Fiji | 61.2 /100 | #167 | Good $54,958 |
| Immigrants | Vietnam | 60.2 /100 | #168 | Good $54,913 |
| French Canadians | 55.6 /100 | #169 | Average $54,722 |
| Finns | 55.6 /100 | #170 | Average $54,721 |
| Immigrants | Peru | 54.9 /100 | #171 | Average $54,695 |
| Welsh | 53.8 /100 | #172 | Average $54,647 |
| South American Indians | 50.4 /100 | #173 | Average $54,508 |
| South Americans | 50.0 /100 | #174 | Average $54,492 |
Demographics Similar to Yup'ik by Median Male Earnings
In terms of median male earnings, the demographic groups most similar to Yup'ik are Tohono O'odham ($39,543, a difference of 0.10%), Puerto Rican ($40,071, a difference of 1.4%), Pueblo ($41,314, a difference of 4.6%), Lumbee ($41,715, a difference of 5.6%), and Arapaho ($41,758, a difference of 5.7%).
| Demographics | Rating | Rank | Median Male Earnings |
| Immigrants | Congo | 0.0 /100 | #333 | Tragic $44,204 |
| Immigrants | Yemen | 0.0 /100 | #334 | Tragic $44,083 |
| Spanish American Indians | 0.0 /100 | #335 | Tragic $44,010 |
| Immigrants | Cuba | 0.0 /100 | #336 | Tragic $43,461 |
| Menominee | 0.0 /100 | #337 | Tragic $42,581 |
| Crow | 0.0 /100 | #338 | Tragic $42,434 |
| Pima | 0.0 /100 | #339 | Tragic $42,357 |
| Navajo | 0.0 /100 | #340 | Tragic $42,098 |
| Hopi | 0.0 /100 | #341 | Tragic $42,060 |
| Arapaho | 0.0 /100 | #342 | Tragic $41,758 |
| Lumbee | 0.0 /100 | #343 | Tragic $41,715 |
| Pueblo | 0.0 /100 | #344 | Tragic $41,314 |
| Puerto Ricans | 0.0 /100 | #345 | Tragic $40,071 |
| Tohono O'odham | 0.0 /100 | #346 | Tragic $39,543 |
| Yup'ik | 0.0 /100 | #347 | Tragic $39,504 |