Immigrants from Europe vs Cambodian Median Family Income
COMPARE
Immigrants from Europe
Cambodian
Median Family Income
Median Family Income Comparison
Immigrants from Europe
Cambodians
$115,523
MEDIAN FAMILY INCOME
99.9/ 100
METRIC RATING
54th/ 347
METRIC RANK
$117,780
MEDIAN FAMILY INCOME
100.0/ 100
METRIC RATING
44th/ 347
METRIC RANK
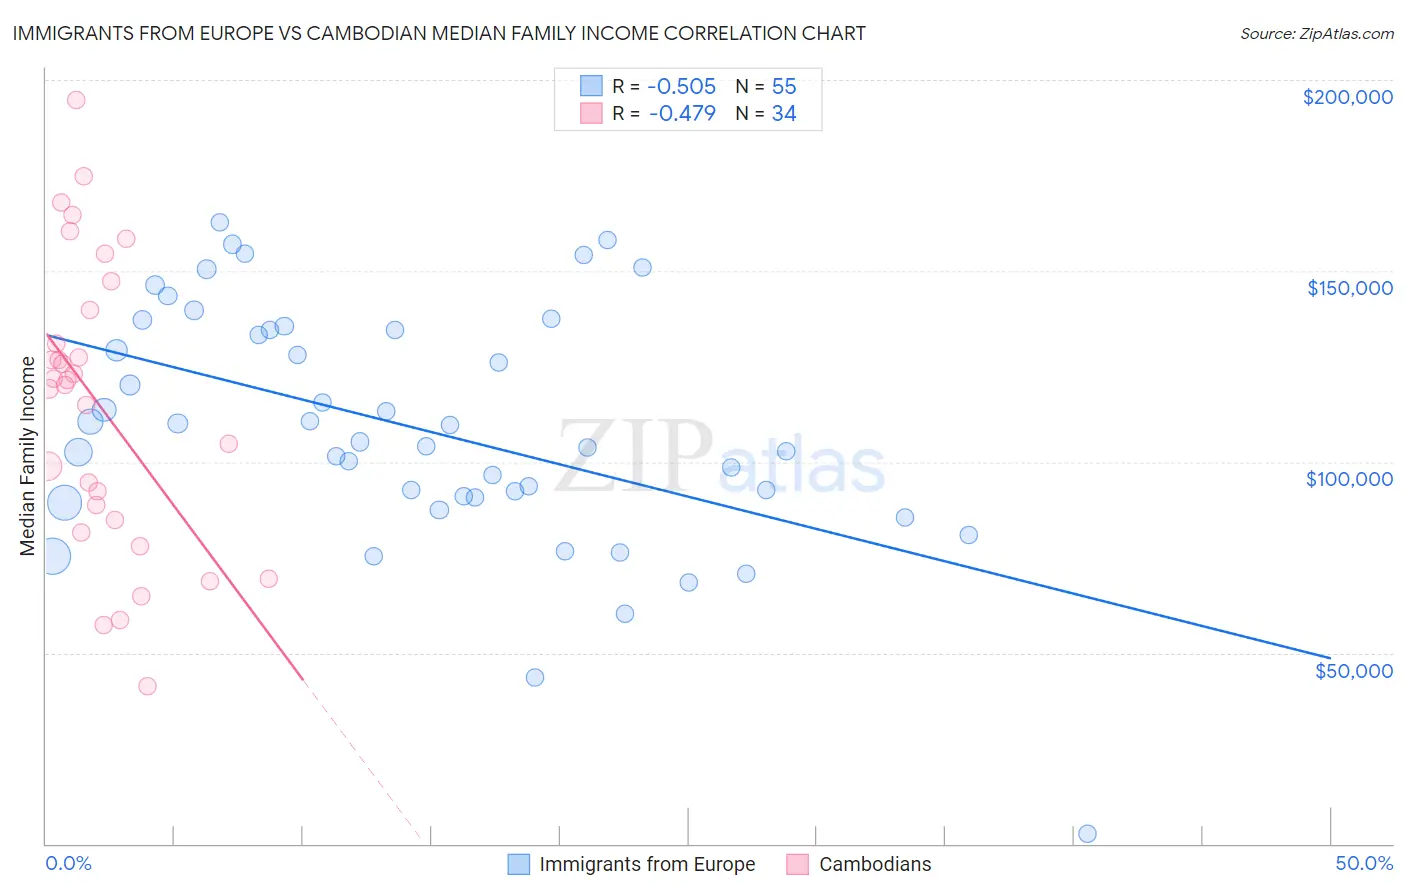
Immigrants from Europe vs Cambodian Median Family Income Correlation Chart
The statistical analysis conducted on geographies consisting of 546,465,722 people shows a substantial negative correlation between the proportion of Immigrants from Europe and median family income in the United States with a correlation coefficient (R) of -0.505 and weighted average of $115,523. Similarly, the statistical analysis conducted on geographies consisting of 102,461,045 people shows a moderate negative correlation between the proportion of Cambodians and median family income in the United States with a correlation coefficient (R) of -0.479 and weighted average of $117,780, a difference of 1.9%.
Median Family Income Correlation Summary
| Measurement | Immigrants from Europe | Cambodian |
| Minimum | $2,499 | $41,250 |
| Maximum | $162,783 | $194,752 |
| Range | $160,284 | $153,502 |
| Mean | $108,657 | $114,811 |
| Median | $105,246 | $120,749 |
| Interquartile 25% (IQ1) | $90,625 | $84,853 |
| Interquartile 75% (IQ3) | $134,559 | $139,722 |
| Interquartile Range (IQR) | $43,934 | $54,869 |
| Standard Deviation (Sample) | $31,673 | $37,903 |
| Standard Deviation (Population) | $31,384 | $37,342 |
Demographics Similar to Immigrants from Europe and Cambodians by Median Family Income
In terms of median family income, the demographic groups most similar to Immigrants from Europe are Lithuanian ($115,395, a difference of 0.11%), New Zealander ($115,230, a difference of 0.25%), Immigrants from Norway ($115,847, a difference of 0.28%), Maltese ($115,862, a difference of 0.29%), and Greek ($115,192, a difference of 0.29%). Similarly, the demographic groups most similar to Cambodians are Bulgarian ($117,818, a difference of 0.030%), Immigrants from Bolivia ($117,912, a difference of 0.11%), Estonian ($118,013, a difference of 0.20%), Immigrants from Lithuania ($118,053, a difference of 0.23%), and Immigrants from Greece ($117,344, a difference of 0.37%).
| Demographics | Rating | Rank | Median Family Income |
| Immigrants | Asia | 100.0 /100 | #39 | Exceptional $118,291 |
| Immigrants | Lithuania | 100.0 /100 | #40 | Exceptional $118,053 |
| Estonians | 100.0 /100 | #41 | Exceptional $118,013 |
| Immigrants | Bolivia | 100.0 /100 | #42 | Exceptional $117,912 |
| Bulgarians | 100.0 /100 | #43 | Exceptional $117,818 |
| Cambodians | 100.0 /100 | #44 | Exceptional $117,780 |
| Immigrants | Greece | 99.9 /100 | #45 | Exceptional $117,344 |
| Immigrants | Russia | 99.9 /100 | #46 | Exceptional $116,942 |
| Immigrants | Austria | 99.9 /100 | #47 | Exceptional $116,830 |
| Immigrants | South Africa | 99.9 /100 | #48 | Exceptional $116,286 |
| Chinese | 99.9 /100 | #49 | Exceptional $116,188 |
| Immigrants | Czechoslovakia | 99.9 /100 | #50 | Exceptional $116,165 |
| Immigrants | Malaysia | 99.9 /100 | #51 | Exceptional $115,880 |
| Maltese | 99.9 /100 | #52 | Exceptional $115,862 |
| Immigrants | Norway | 99.9 /100 | #53 | Exceptional $115,847 |
| Immigrants | Europe | 99.9 /100 | #54 | Exceptional $115,523 |
| Lithuanians | 99.8 /100 | #55 | Exceptional $115,395 |
| New Zealanders | 99.8 /100 | #56 | Exceptional $115,230 |
| Greeks | 99.8 /100 | #57 | Exceptional $115,192 |
| Immigrants | Indonesia | 99.8 /100 | #58 | Exceptional $115,162 |
| Immigrants | Netherlands | 99.8 /100 | #59 | Exceptional $114,987 |