Immigrants from El Salvador vs Immigrants from India Ambulatory Disability
COMPARE
Immigrants from El Salvador
Immigrants from India
Ambulatory Disability
Ambulatory Disability Comparison
Immigrants from El Salvador
Immigrants from India
5.8%
AMBULATORY DISABILITY
98.4/ 100
METRIC RATING
95th/ 347
METRIC RANK
4.8%
AMBULATORY DISABILITY
100.0/ 100
METRIC RATING
1st/ 347
METRIC RANK
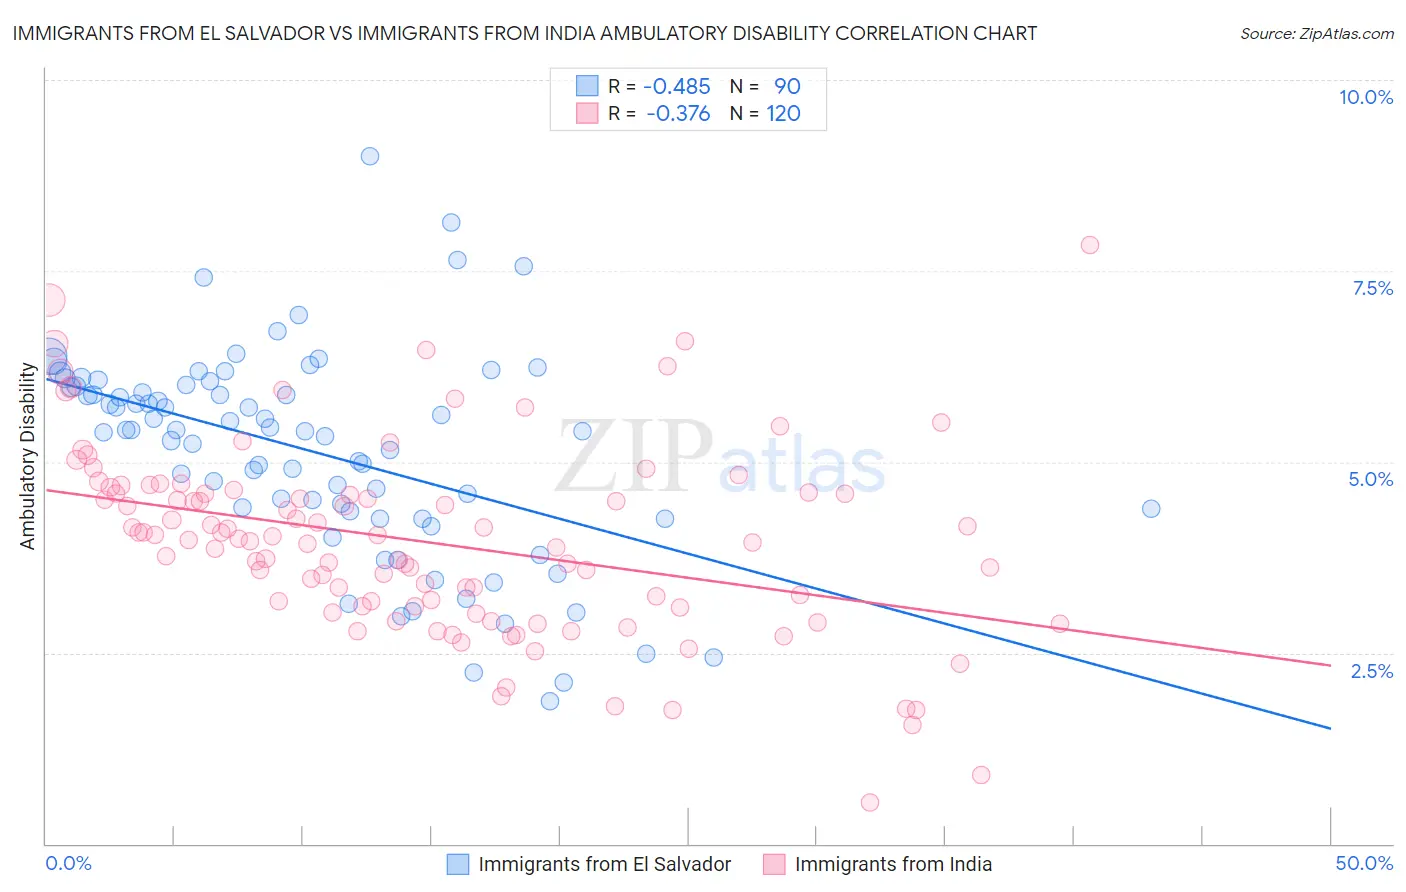
Immigrants from El Salvador vs Immigrants from India Ambulatory Disability Correlation Chart
The statistical analysis conducted on geographies consisting of 357,732,482 people shows a moderate negative correlation between the proportion of Immigrants from El Salvador and percentage of population with ambulatory disability in the United States with a correlation coefficient (R) of -0.485 and weighted average of 5.8%. Similarly, the statistical analysis conducted on geographies consisting of 433,949,483 people shows a mild negative correlation between the proportion of Immigrants from India and percentage of population with ambulatory disability in the United States with a correlation coefficient (R) of -0.376 and weighted average of 4.8%, a difference of 21.3%.
Ambulatory Disability Correlation Summary
| Measurement | Immigrants from El Salvador | Immigrants from India |
| Minimum | 1.9% | 0.54% |
| Maximum | 9.0% | 7.8% |
| Range | 7.1% | 7.3% |
| Mean | 5.1% | 4.0% |
| Median | 5.4% | 4.0% |
| Interquartile 25% (IQ1) | 4.4% | 3.1% |
| Interquartile 75% (IQ3) | 6.0% | 4.6% |
| Interquartile Range (IQR) | 1.6% | 1.5% |
| Standard Deviation (Sample) | 1.4% | 1.3% |
| Standard Deviation (Population) | 1.4% | 1.2% |
Similar Demographics by Ambulatory Disability
Demographics Similar to Immigrants from El Salvador by Ambulatory Disability
In terms of ambulatory disability, the demographic groups most similar to Immigrants from El Salvador are Salvadoran (5.8%, a difference of 0.020%), Kenyan (5.8%, a difference of 0.040%), Immigrants from Somalia (5.8%, a difference of 0.060%), Immigrants from Lebanon (5.8%, a difference of 0.090%), and Immigrants from Northern Europe (5.8%, a difference of 0.17%).
| Demographics | Rating | Rank | Ambulatory Disability |
| Soviet Union | 98.9 /100 | #88 | Exceptional 5.8% |
| Bhutanese | 98.8 /100 | #89 | Exceptional 5.8% |
| Australians | 98.8 /100 | #90 | Exceptional 5.8% |
| Immigrants | Sudan | 98.8 /100 | #91 | Exceptional 5.8% |
| Immigrants | Sierra Leone | 98.6 /100 | #92 | Exceptional 5.8% |
| Immigrants | Denmark | 98.6 /100 | #93 | Exceptional 5.8% |
| Kenyans | 98.4 /100 | #94 | Exceptional 5.8% |
| Immigrants | El Salvador | 98.4 /100 | #95 | Exceptional 5.8% |
| Salvadorans | 98.4 /100 | #96 | Exceptional 5.8% |
| Immigrants | Somalia | 98.3 /100 | #97 | Exceptional 5.8% |
| Immigrants | Lebanon | 98.3 /100 | #98 | Exceptional 5.8% |
| Immigrants | Northern Europe | 98.2 /100 | #99 | Exceptional 5.8% |
| Immigrants | Serbia | 97.9 /100 | #100 | Exceptional 5.8% |
| Immigrants | South America | 97.9 /100 | #101 | Exceptional 5.8% |
| Immigrants | Kenya | 97.8 /100 | #102 | Exceptional 5.8% |
Demographics Similar to Immigrants from India by Ambulatory Disability
In terms of ambulatory disability, the demographic groups most similar to Immigrants from India are Filipino (4.9%, a difference of 2.0%), Thai (4.9%, a difference of 3.2%), Immigrants from Taiwan (4.9%, a difference of 3.5%), Immigrants from Singapore (5.0%, a difference of 4.9%), and Immigrants from Bolivia (5.0%, a difference of 5.7%).
| Demographics | Rating | Rank | Ambulatory Disability |
| Immigrants | India | 100.0 /100 | #1 | Exceptional 4.8% |
| Filipinos | 100.0 /100 | #2 | Exceptional 4.9% |
| Thais | 100.0 /100 | #3 | Exceptional 4.9% |
| Immigrants | Taiwan | 100.0 /100 | #4 | Exceptional 4.9% |
| Immigrants | Singapore | 100.0 /100 | #5 | Exceptional 5.0% |
| Immigrants | Bolivia | 100.0 /100 | #6 | Exceptional 5.0% |
| Bolivians | 100.0 /100 | #7 | Exceptional 5.1% |
| Immigrants | South Central Asia | 100.0 /100 | #8 | Exceptional 5.1% |
| Iranians | 100.0 /100 | #9 | Exceptional 5.1% |
| Yup'ik | 100.0 /100 | #10 | Exceptional 5.2% |
| Immigrants | Korea | 100.0 /100 | #11 | Exceptional 5.2% |
| Okinawans | 100.0 /100 | #12 | Exceptional 5.3% |
| Burmese | 100.0 /100 | #13 | Exceptional 5.3% |
| Immigrants | Eastern Asia | 100.0 /100 | #14 | Exceptional 5.3% |
| Immigrants | China | 100.0 /100 | #15 | Exceptional 5.3% |