Immigrants from Dominica vs Belizean Median Male Earnings
COMPARE
Immigrants from Dominica
Belizean
Median Male Earnings
Median Male Earnings Comparison
Immigrants from Dominica
Belizeans
$47,651
MEDIAN MALE EARNINGS
0.1/ 100
METRIC RATING
292nd/ 347
METRIC RANK
$48,358
MEDIAN MALE EARNINGS
0.2/ 100
METRIC RATING
277th/ 347
METRIC RANK
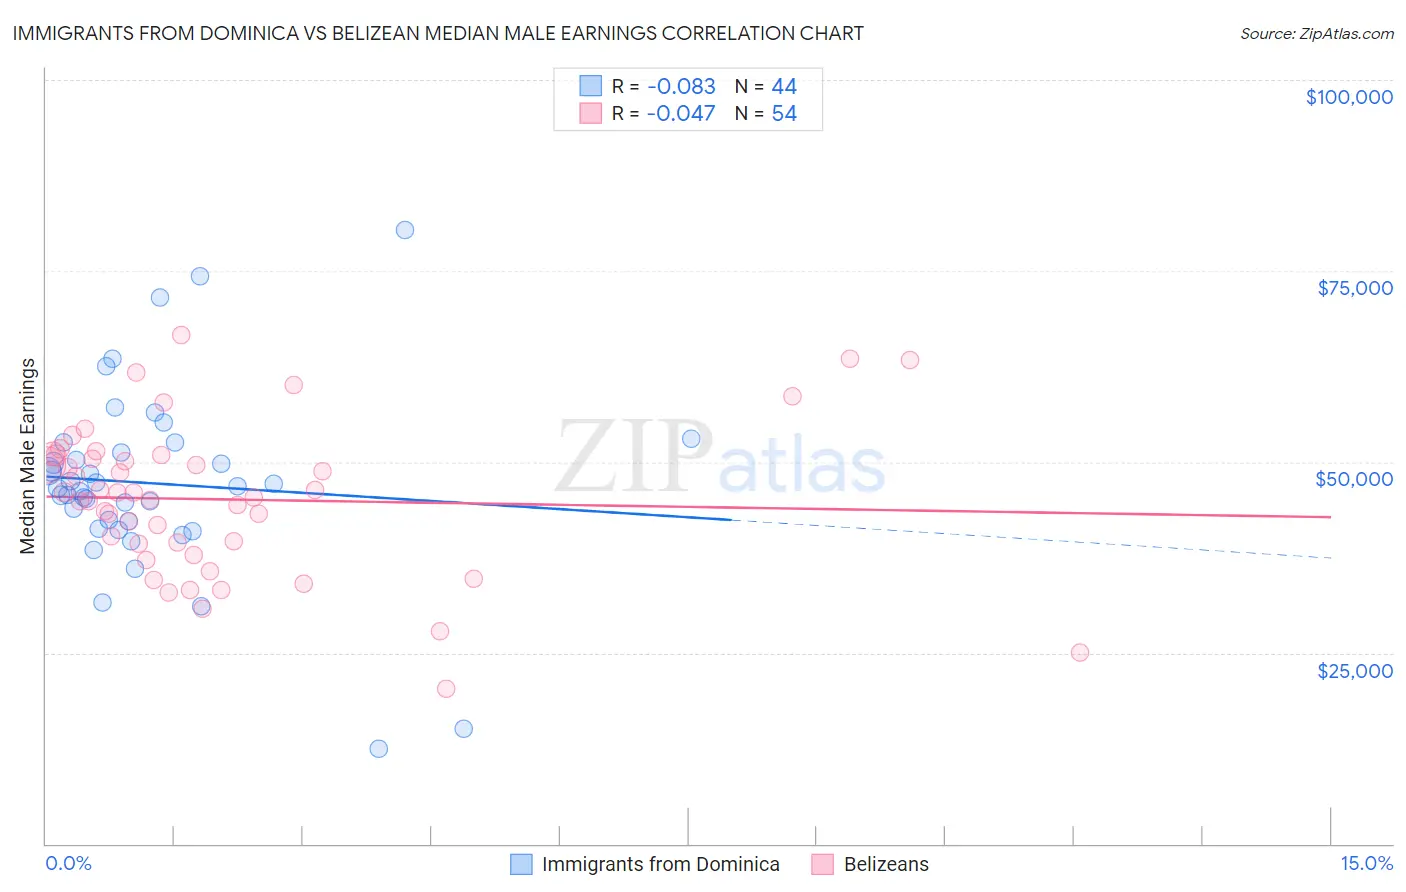
Immigrants from Dominica vs Belizean Median Male Earnings Correlation Chart
The statistical analysis conducted on geographies consisting of 83,786,748 people shows a slight negative correlation between the proportion of Immigrants from Dominica and median male earnings in the United States with a correlation coefficient (R) of -0.083 and weighted average of $47,651. Similarly, the statistical analysis conducted on geographies consisting of 144,207,760 people shows no correlation between the proportion of Belizeans and median male earnings in the United States with a correlation coefficient (R) of -0.047 and weighted average of $48,358, a difference of 1.5%.
Median Male Earnings Correlation Summary
| Measurement | Immigrants from Dominica | Belizean |
| Minimum | $12,476 | $20,292 |
| Maximum | $80,370 | $66,580 |
| Range | $67,894 | $46,288 |
| Mean | $47,178 | $45,078 |
| Median | $46,677 | $45,641 |
| Interquartile 25% (IQ1) | $41,694 | $39,349 |
| Interquartile 75% (IQ3) | $51,930 | $50,831 |
| Interquartile Range (IQR) | $10,236 | $11,482 |
| Standard Deviation (Sample) | $12,354 | $9,817 |
| Standard Deviation (Population) | $12,213 | $9,725 |
Demographics Similar to Immigrants from Dominica and Belizeans by Median Male Earnings
In terms of median male earnings, the demographic groups most similar to Immigrants from Dominica are Choctaw ($47,729, a difference of 0.16%), Indonesian ($47,503, a difference of 0.31%), Immigrants from Belize ($47,809, a difference of 0.33%), Immigrants from Nicaragua ($47,482, a difference of 0.36%), and Chickasaw ($47,832, a difference of 0.38%). Similarly, the demographic groups most similar to Belizeans are Immigrants from Liberia ($48,317, a difference of 0.080%), Blackfeet ($48,402, a difference of 0.090%), Immigrants from Somalia ($48,439, a difference of 0.17%), Hmong ($48,254, a difference of 0.22%), and Comanche ($48,202, a difference of 0.32%).
| Demographics | Rating | Rank | Median Male Earnings |
| Colville | 0.3 /100 | #274 | Tragic $48,516 |
| Immigrants | Somalia | 0.3 /100 | #275 | Tragic $48,439 |
| Blackfeet | 0.3 /100 | #276 | Tragic $48,402 |
| Belizeans | 0.2 /100 | #277 | Tragic $48,358 |
| Immigrants | Liberia | 0.2 /100 | #278 | Tragic $48,317 |
| Hmong | 0.2 /100 | #279 | Tragic $48,254 |
| Comanche | 0.2 /100 | #280 | Tragic $48,202 |
| Marshallese | 0.2 /100 | #281 | Tragic $48,137 |
| Central Americans | 0.2 /100 | #282 | Tragic $48,093 |
| Immigrants | Jamaica | 0.2 /100 | #283 | Tragic $48,040 |
| Africans | 0.2 /100 | #284 | Tragic $47,994 |
| Paiute | 0.2 /100 | #285 | Tragic $47,991 |
| Mexican American Indians | 0.2 /100 | #286 | Tragic $47,990 |
| Immigrants | El Salvador | 0.2 /100 | #287 | Tragic $47,973 |
| Shoshone | 0.2 /100 | #288 | Tragic $47,930 |
| Chickasaw | 0.1 /100 | #289 | Tragic $47,832 |
| Immigrants | Belize | 0.1 /100 | #290 | Tragic $47,809 |
| Choctaw | 0.1 /100 | #291 | Tragic $47,729 |
| Immigrants | Dominica | 0.1 /100 | #292 | Tragic $47,651 |
| Indonesians | 0.1 /100 | #293 | Tragic $47,503 |
| Immigrants | Nicaragua | 0.1 /100 | #294 | Tragic $47,482 |