Immigrants from Dominica vs Yakama Median Male Earnings
COMPARE
Immigrants from Dominica
Yakama
Median Male Earnings
Median Male Earnings Comparison
Immigrants from Dominica
Yakama
$47,651
MEDIAN MALE EARNINGS
0.1/ 100
METRIC RATING
292nd/ 347
METRIC RANK
$45,002
MEDIAN MALE EARNINGS
0.0/ 100
METRIC RATING
329th/ 347
METRIC RANK
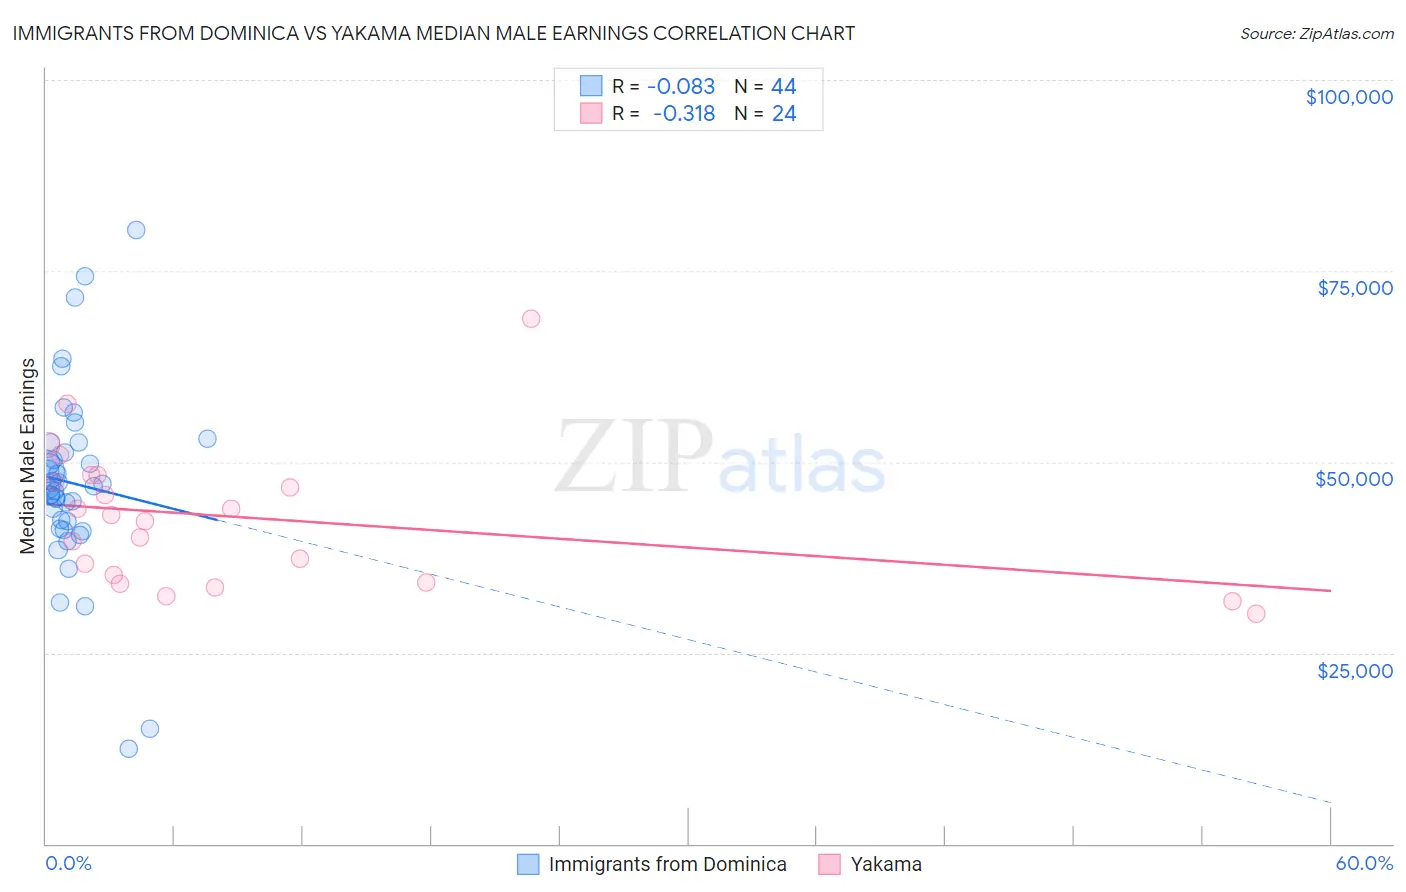
Immigrants from Dominica vs Yakama Median Male Earnings Correlation Chart
The statistical analysis conducted on geographies consisting of 83,786,748 people shows a slight negative correlation between the proportion of Immigrants from Dominica and median male earnings in the United States with a correlation coefficient (R) of -0.083 and weighted average of $47,651. Similarly, the statistical analysis conducted on geographies consisting of 19,920,033 people shows a mild negative correlation between the proportion of Yakama and median male earnings in the United States with a correlation coefficient (R) of -0.318 and weighted average of $45,002, a difference of 5.9%.
Median Male Earnings Correlation Summary
| Measurement | Immigrants from Dominica | Yakama |
| Minimum | $12,476 | $30,179 |
| Maximum | $80,370 | $68,750 |
| Range | $67,894 | $38,571 |
| Mean | $47,178 | $42,657 |
| Median | $46,677 | $42,664 |
| Interquartile 25% (IQ1) | $41,694 | $34,669 |
| Interquartile 75% (IQ3) | $51,930 | $47,788 |
| Interquartile Range (IQR) | $10,236 | $13,119 |
| Standard Deviation (Sample) | $12,354 | $9,142 |
| Standard Deviation (Population) | $12,213 | $8,950 |
Similar Demographics by Median Male Earnings
Demographics Similar to Immigrants from Dominica by Median Male Earnings
In terms of median male earnings, the demographic groups most similar to Immigrants from Dominica are Choctaw ($47,729, a difference of 0.16%), Indonesian ($47,503, a difference of 0.31%), Immigrants from Belize ($47,809, a difference of 0.33%), Immigrants from Nicaragua ($47,482, a difference of 0.36%), and Chickasaw ($47,832, a difference of 0.38%).
| Demographics | Rating | Rank | Median Male Earnings |
| Paiute | 0.2 /100 | #285 | Tragic $47,991 |
| Mexican American Indians | 0.2 /100 | #286 | Tragic $47,990 |
| Immigrants | El Salvador | 0.2 /100 | #287 | Tragic $47,973 |
| Shoshone | 0.2 /100 | #288 | Tragic $47,930 |
| Chickasaw | 0.1 /100 | #289 | Tragic $47,832 |
| Immigrants | Belize | 0.1 /100 | #290 | Tragic $47,809 |
| Choctaw | 0.1 /100 | #291 | Tragic $47,729 |
| Immigrants | Dominica | 0.1 /100 | #292 | Tragic $47,651 |
| Indonesians | 0.1 /100 | #293 | Tragic $47,503 |
| Immigrants | Nicaragua | 0.1 /100 | #294 | Tragic $47,482 |
| Central American Indians | 0.1 /100 | #295 | Tragic $47,433 |
| Inupiat | 0.1 /100 | #296 | Tragic $47,281 |
| Dominicans | 0.1 /100 | #297 | Tragic $47,204 |
| Immigrants | Micronesia | 0.1 /100 | #298 | Tragic $47,177 |
| Immigrants | Zaire | 0.1 /100 | #299 | Tragic $47,070 |
Demographics Similar to Yakama by Median Male Earnings
In terms of median male earnings, the demographic groups most similar to Yakama are Immigrants from Mexico ($44,960, a difference of 0.090%), Kiowa ($45,094, a difference of 0.20%), Immigrants from Bahamas ($45,176, a difference of 0.39%), Native/Alaskan ($44,775, a difference of 0.51%), and Bahamian ($44,756, a difference of 0.55%).
| Demographics | Rating | Rank | Median Male Earnings |
| Sioux | 0.0 /100 | #322 | Tragic $45,566 |
| Immigrants | Central America | 0.0 /100 | #323 | Tragic $45,538 |
| Blacks/African Americans | 0.0 /100 | #324 | Tragic $45,523 |
| Yuman | 0.0 /100 | #325 | Tragic $45,446 |
| Immigrants | Haiti | 0.0 /100 | #326 | Tragic $45,266 |
| Immigrants | Bahamas | 0.0 /100 | #327 | Tragic $45,176 |
| Kiowa | 0.0 /100 | #328 | Tragic $45,094 |
| Yakama | 0.0 /100 | #329 | Tragic $45,002 |
| Immigrants | Mexico | 0.0 /100 | #330 | Tragic $44,960 |
| Natives/Alaskans | 0.0 /100 | #331 | Tragic $44,775 |
| Bahamians | 0.0 /100 | #332 | Tragic $44,756 |
| Immigrants | Congo | 0.0 /100 | #333 | Tragic $44,204 |
| Immigrants | Yemen | 0.0 /100 | #334 | Tragic $44,083 |
| Spanish American Indians | 0.0 /100 | #335 | Tragic $44,010 |
| Immigrants | Cuba | 0.0 /100 | #336 | Tragic $43,461 |