British West Indian vs Belizean Median Male Earnings
COMPARE
British West Indian
Belizean
Median Male Earnings
Median Male Earnings Comparison
British West Indians
Belizeans
$49,636
MEDIAN MALE EARNINGS
0.8/ 100
METRIC RATING
257th/ 347
METRIC RANK
$48,358
MEDIAN MALE EARNINGS
0.2/ 100
METRIC RATING
277th/ 347
METRIC RANK
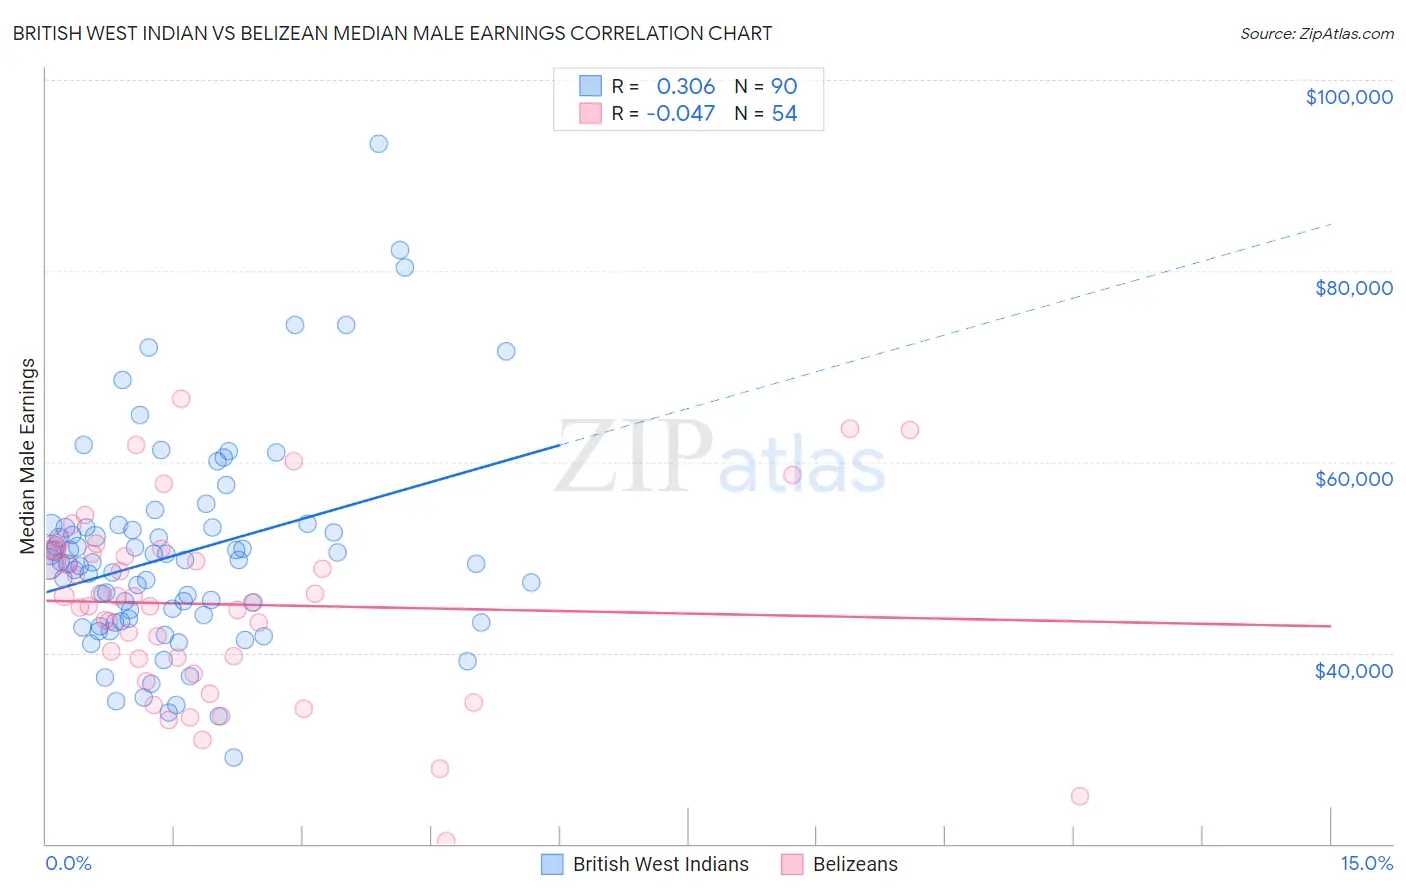
British West Indian vs Belizean Median Male Earnings Correlation Chart
The statistical analysis conducted on geographies consisting of 152,683,188 people shows a mild positive correlation between the proportion of British West Indians and median male earnings in the United States with a correlation coefficient (R) of 0.306 and weighted average of $49,636. Similarly, the statistical analysis conducted on geographies consisting of 144,207,760 people shows no correlation between the proportion of Belizeans and median male earnings in the United States with a correlation coefficient (R) of -0.047 and weighted average of $48,358, a difference of 2.6%.
Median Male Earnings Correlation Summary
| Measurement | British West Indian | Belizean |
| Minimum | $28,979 | $20,292 |
| Maximum | $93,333 | $66,580 |
| Range | $64,354 | $46,288 |
| Mean | $50,358 | $45,078 |
| Median | $49,413 | $45,641 |
| Interquartile 25% (IQ1) | $43,337 | $39,349 |
| Interquartile 75% (IQ3) | $53,079 | $50,831 |
| Interquartile Range (IQR) | $9,742 | $11,482 |
| Standard Deviation (Sample) | $11,060 | $9,817 |
| Standard Deviation (Population) | $10,999 | $9,725 |
Demographics Similar to British West Indians and Belizeans by Median Male Earnings
In terms of median male earnings, the demographic groups most similar to British West Indians are Cree ($49,497, a difference of 0.28%), Nepalese ($49,458, a difference of 0.36%), Iroquois ($49,374, a difference of 0.53%), Liberian ($49,318, a difference of 0.64%), and Immigrants from West Indies ($49,271, a difference of 0.74%). Similarly, the demographic groups most similar to Belizeans are Blackfeet ($48,402, a difference of 0.090%), Immigrants from Somalia ($48,439, a difference of 0.17%), Colville ($48,516, a difference of 0.33%), Jamaican ($48,632, a difference of 0.57%), and Salvadoran ($48,646, a difference of 0.60%).
| Demographics | Rating | Rank | Median Male Earnings |
| British West Indians | 0.8 /100 | #257 | Tragic $49,636 |
| Cree | 0.7 /100 | #258 | Tragic $49,497 |
| Nepalese | 0.7 /100 | #259 | Tragic $49,458 |
| Iroquois | 0.7 /100 | #260 | Tragic $49,374 |
| Liberians | 0.6 /100 | #261 | Tragic $49,318 |
| Immigrants | West Indies | 0.6 /100 | #262 | Tragic $49,271 |
| Nicaraguans | 0.6 /100 | #263 | Tragic $49,215 |
| Immigrants | Middle Africa | 0.6 /100 | #264 | Tragic $49,201 |
| Immigrants | Laos | 0.6 /100 | #265 | Tragic $49,190 |
| Somalis | 0.5 /100 | #266 | Tragic $49,025 |
| Spanish Americans | 0.5 /100 | #267 | Tragic $49,008 |
| Ute | 0.4 /100 | #268 | Tragic $48,899 |
| Tsimshian | 0.4 /100 | #269 | Tragic $48,836 |
| Potawatomi | 0.4 /100 | #270 | Tragic $48,768 |
| Cherokee | 0.3 /100 | #271 | Tragic $48,669 |
| Salvadorans | 0.3 /100 | #272 | Tragic $48,646 |
| Jamaicans | 0.3 /100 | #273 | Tragic $48,632 |
| Colville | 0.3 /100 | #274 | Tragic $48,516 |
| Immigrants | Somalia | 0.3 /100 | #275 | Tragic $48,439 |
| Blackfeet | 0.3 /100 | #276 | Tragic $48,402 |
| Belizeans | 0.2 /100 | #277 | Tragic $48,358 |