Immigrants from Canada vs Immigrants from Bahamas Householder Income Under 25 years
COMPARE
Immigrants from Canada
Immigrants from Bahamas
Householder Income Under 25 years
Householder Income Under 25 years Comparison
Immigrants from Canada
Immigrants from Bahamas
$53,411
HOUSEHOLDER INCOME UNDER 25 YEARS
95.2/ 100
METRIC RATING
121st/ 347
METRIC RANK
$45,793
HOUSEHOLDER INCOME UNDER 25 YEARS
0.0/ 100
METRIC RATING
325th/ 347
METRIC RANK
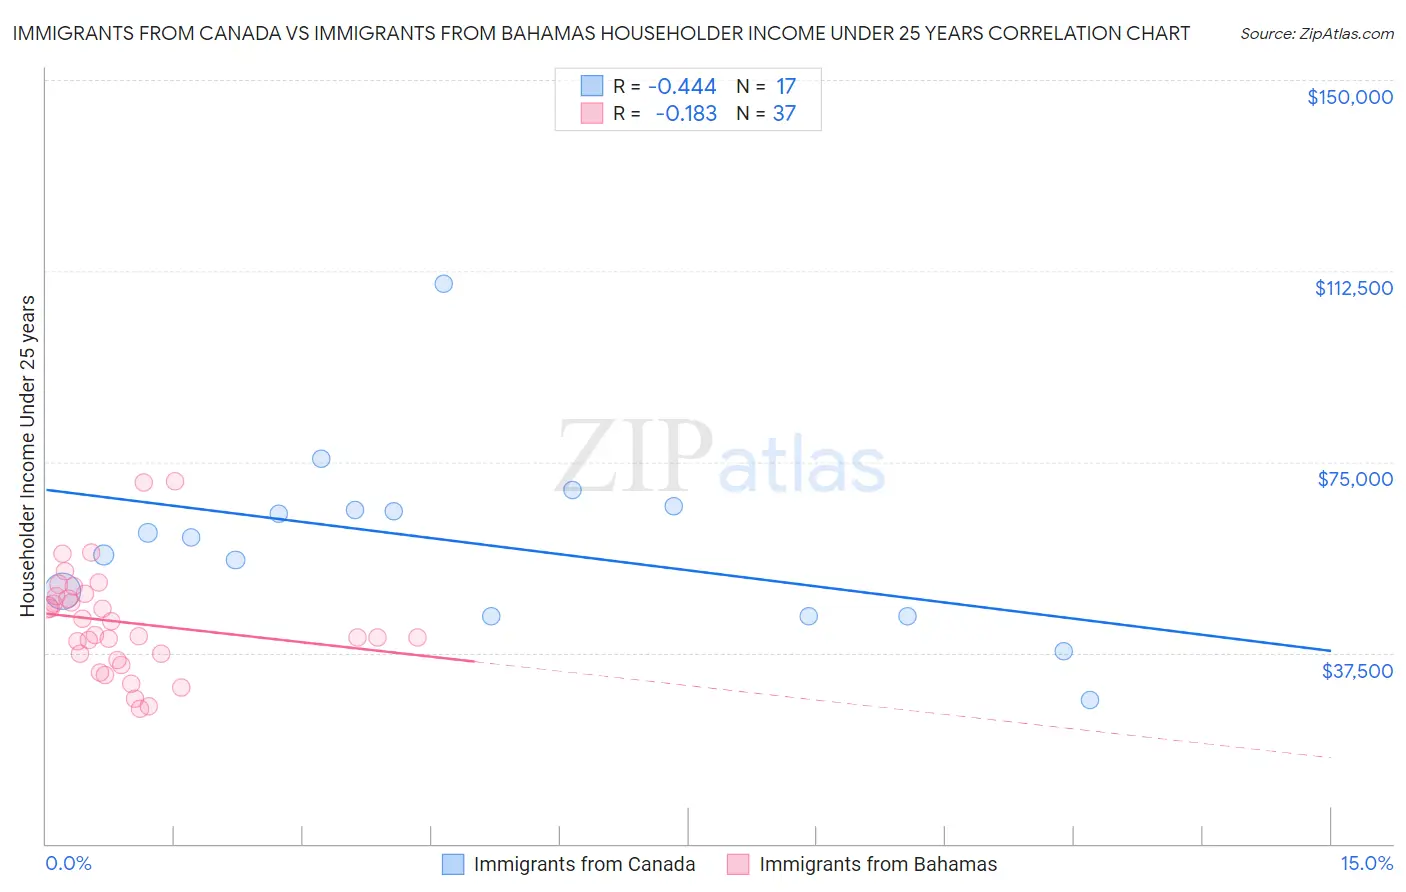
Immigrants from Canada vs Immigrants from Bahamas Householder Income Under 25 years Correlation Chart
The statistical analysis conducted on geographies consisting of 375,368,840 people shows a moderate negative correlation between the proportion of Immigrants from Canada and household income with householder under the age of 25 in the United States with a correlation coefficient (R) of -0.444 and weighted average of $53,411. Similarly, the statistical analysis conducted on geographies consisting of 97,494,664 people shows a poor negative correlation between the proportion of Immigrants from Bahamas and household income with householder under the age of 25 in the United States with a correlation coefficient (R) of -0.183 and weighted average of $45,793, a difference of 16.6%.
Householder Income Under 25 years Correlation Summary
| Measurement | Immigrants from Canada | Immigrants from Bahamas |
| Minimum | $28,317 | $26,418 |
| Maximum | $109,961 | $71,250 |
| Range | $81,644 | $44,832 |
| Mean | $58,863 | $43,510 |
| Median | $60,245 | $41,087 |
| Interquartile 25% (IQ1) | $44,733 | $36,692 |
| Interquartile 75% (IQ3) | $65,961 | $48,889 |
| Interquartile Range (IQR) | $21,228 | $12,196 |
| Standard Deviation (Sample) | $18,135 | $10,378 |
| Standard Deviation (Population) | $17,594 | $10,237 |
Similar Demographics by Householder Income Under 25 years
Demographics Similar to Immigrants from Canada by Householder Income Under 25 years
In terms of householder income under 25 years, the demographic groups most similar to Immigrants from Canada are Immigrants from Ethiopia ($53,408, a difference of 0.010%), Guamanian/Chamorro ($53,423, a difference of 0.020%), Italian ($53,426, a difference of 0.030%), Immigrants from Iraq ($53,384, a difference of 0.050%), and Colombian ($53,357, a difference of 0.10%).
| Demographics | Rating | Rank | Householder Income Under 25 years |
| Immigrants | Sweden | 97.1 /100 | #114 | Exceptional $53,621 |
| Immigrants | Albania | 96.9 /100 | #115 | Exceptional $53,597 |
| Immigrants | Spain | 96.6 /100 | #116 | Exceptional $53,560 |
| Lithuanians | 96.6 /100 | #117 | Exceptional $53,552 |
| Immigrants | Switzerland | 96.3 /100 | #118 | Exceptional $53,528 |
| Italians | 95.4 /100 | #119 | Exceptional $53,426 |
| Guamanians/Chamorros | 95.3 /100 | #120 | Exceptional $53,423 |
| Immigrants | Canada | 95.2 /100 | #121 | Exceptional $53,411 |
| Immigrants | Ethiopia | 95.2 /100 | #122 | Exceptional $53,408 |
| Immigrants | Iraq | 94.9 /100 | #123 | Exceptional $53,384 |
| Colombians | 94.6 /100 | #124 | Exceptional $53,357 |
| Pakistanis | 94.1 /100 | #125 | Exceptional $53,325 |
| Immigrants | Serbia | 94.1 /100 | #126 | Exceptional $53,321 |
| Immigrants | North America | 93.9 /100 | #127 | Exceptional $53,307 |
| Immigrants | Bulgaria | 93.9 /100 | #128 | Exceptional $53,305 |
Demographics Similar to Immigrants from Bahamas by Householder Income Under 25 years
In terms of householder income under 25 years, the demographic groups most similar to Immigrants from Bahamas are Dutch West Indian ($45,816, a difference of 0.050%), Osage ($45,764, a difference of 0.060%), Bahamian ($45,743, a difference of 0.11%), German Russian ($45,673, a difference of 0.26%), and Seminole ($45,649, a difference of 0.32%).
| Demographics | Rating | Rank | Householder Income Under 25 years |
| Spanish Americans | 0.0 /100 | #318 | Tragic $46,913 |
| Africans | 0.0 /100 | #319 | Tragic $46,838 |
| Immigrants | Sudan | 0.0 /100 | #320 | Tragic $46,791 |
| Potawatomi | 0.0 /100 | #321 | Tragic $46,462 |
| Sioux | 0.0 /100 | #322 | Tragic $46,417 |
| Immigrants | Saudi Arabia | 0.0 /100 | #323 | Tragic $46,187 |
| Dutch West Indians | 0.0 /100 | #324 | Tragic $45,816 |
| Immigrants | Bahamas | 0.0 /100 | #325 | Tragic $45,793 |
| Osage | 0.0 /100 | #326 | Tragic $45,764 |
| Bahamians | 0.0 /100 | #327 | Tragic $45,743 |
| German Russians | 0.0 /100 | #328 | Tragic $45,673 |
| Seminole | 0.0 /100 | #329 | Tragic $45,649 |
| Indonesians | 0.0 /100 | #330 | Tragic $45,566 |
| Immigrants | Zaire | 0.0 /100 | #331 | Tragic $45,529 |
| Choctaw | 0.0 /100 | #332 | Tragic $45,450 |