Immigrants from Canada vs Australian Householder Income Over 65 years
COMPARE
Immigrants from Canada
Australian
Householder Income Over 65 years
Householder Income Over 65 years Comparison
Immigrants from Canada
Australians
$64,952
HOUSEHOLDER INCOME OVER 65 YEARS
98.5/ 100
METRIC RATING
77th/ 347
METRIC RANK
$66,891
HOUSEHOLDER INCOME OVER 65 YEARS
99.8/ 100
METRIC RATING
47th/ 347
METRIC RANK
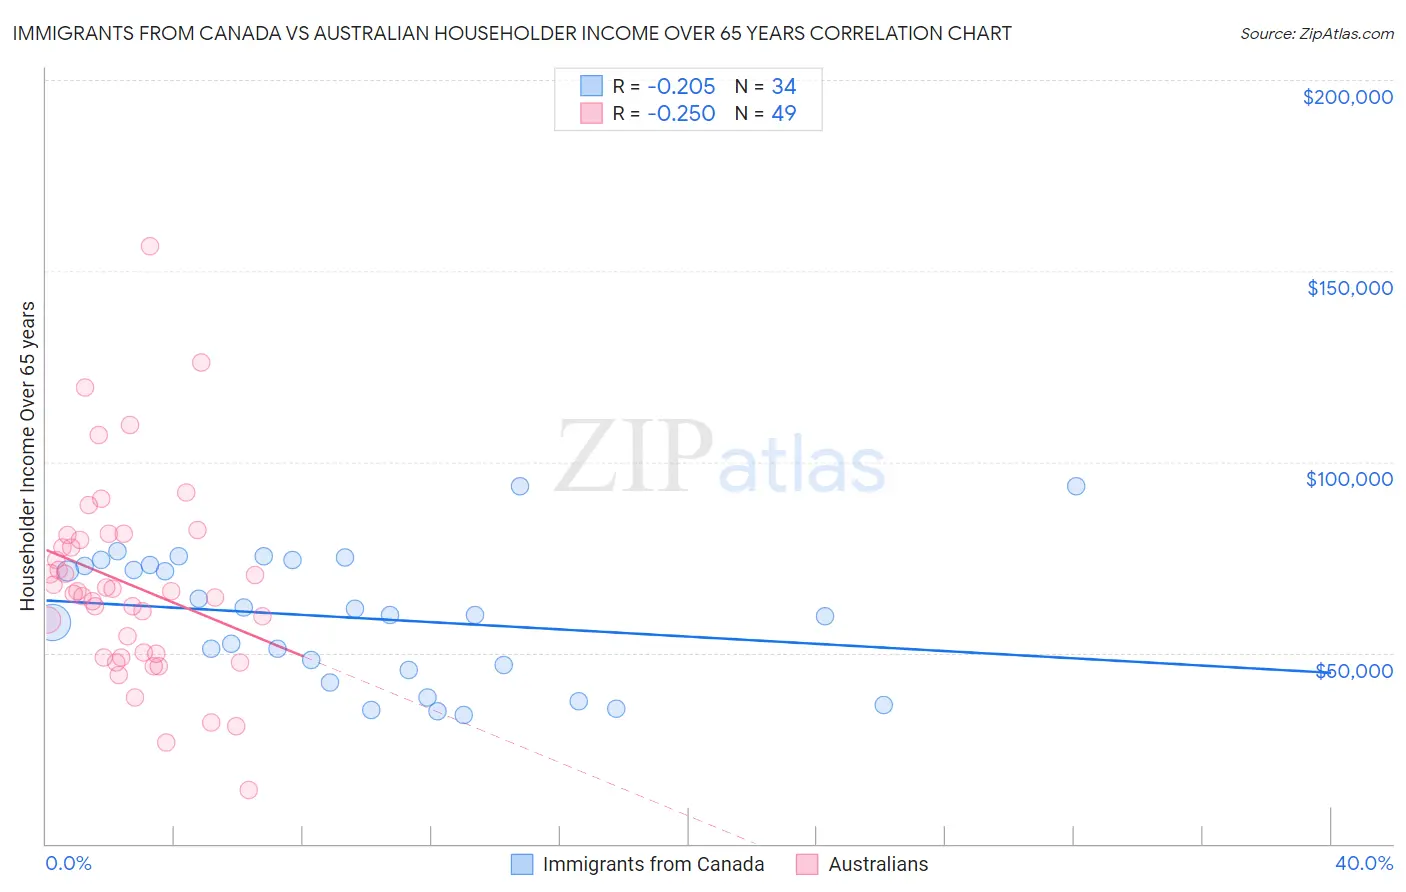
Immigrants from Canada vs Australian Householder Income Over 65 years Correlation Chart
The statistical analysis conducted on geographies consisting of 457,762,448 people shows a weak negative correlation between the proportion of Immigrants from Canada and household income with householder over the age of 65 in the United States with a correlation coefficient (R) of -0.205 and weighted average of $64,952. Similarly, the statistical analysis conducted on geographies consisting of 223,634,987 people shows a weak negative correlation between the proportion of Australians and household income with householder over the age of 65 in the United States with a correlation coefficient (R) of -0.250 and weighted average of $66,891, a difference of 3.0%.
Householder Income Over 65 years Correlation Summary
| Measurement | Immigrants from Canada | Australian |
| Minimum | $33,841 | $13,929 |
| Maximum | $93,750 | $156,341 |
| Range | $59,909 | $142,412 |
| Mean | $59,160 | $67,933 |
| Median | $59,957 | $66,111 |
| Interquartile 25% (IQ1) | $45,537 | $49,254 |
| Interquartile 75% (IQ3) | $73,144 | $80,198 |
| Interquartile Range (IQR) | $27,607 | $30,944 |
| Standard Deviation (Sample) | $16,989 | $25,877 |
| Standard Deviation (Population) | $16,737 | $25,612 |
Similar Demographics by Householder Income Over 65 years
Demographics Similar to Immigrants from Canada by Householder Income Over 65 years
In terms of householder income over 65 years, the demographic groups most similar to Immigrants from Canada are Immigrants from Western Europe ($64,933, a difference of 0.030%), Hawaiian ($64,920, a difference of 0.050%), Ethiopian ($64,989, a difference of 0.060%), Sierra Leonean ($65,038, a difference of 0.13%), and Immigrants from North America ($64,856, a difference of 0.15%).
| Demographics | Rating | Rank | Householder Income Over 65 years |
| Mongolians | 99.0 /100 | #70 | Exceptional $65,326 |
| Greeks | 98.9 /100 | #71 | Exceptional $65,306 |
| Argentineans | 98.9 /100 | #72 | Exceptional $65,246 |
| Immigrants | Ethiopia | 98.9 /100 | #73 | Exceptional $65,238 |
| Lithuanians | 98.8 /100 | #74 | Exceptional $65,209 |
| Sierra Leoneans | 98.6 /100 | #75 | Exceptional $65,038 |
| Ethiopians | 98.5 /100 | #76 | Exceptional $64,989 |
| Immigrants | Canada | 98.5 /100 | #77 | Exceptional $64,952 |
| Immigrants | Western Europe | 98.5 /100 | #78 | Exceptional $64,933 |
| Hawaiians | 98.4 /100 | #79 | Exceptional $64,920 |
| Immigrants | North America | 98.3 /100 | #80 | Exceptional $64,856 |
| Immigrants | Europe | 98.3 /100 | #81 | Exceptional $64,828 |
| Immigrants | Fiji | 98.2 /100 | #82 | Exceptional $64,795 |
| Northern Europeans | 97.9 /100 | #83 | Exceptional $64,658 |
| Immigrants | Greece | 97.9 /100 | #84 | Exceptional $64,636 |
Demographics Similar to Australians by Householder Income Over 65 years
In terms of householder income over 65 years, the demographic groups most similar to Australians are Cambodian ($66,892, a difference of 0.0%), Immigrants from France ($66,826, a difference of 0.10%), Immigrants from Afghanistan ($67,007, a difference of 0.17%), Immigrants from Indonesia ($66,694, a difference of 0.29%), and Immigrants from Turkey ($66,672, a difference of 0.33%).
| Demographics | Rating | Rank | Householder Income Over 65 years |
| Immigrants | Asia | 99.9 /100 | #40 | Exceptional $67,594 |
| Koreans | 99.9 /100 | #41 | Exceptional $67,472 |
| New Zealanders | 99.9 /100 | #42 | Exceptional $67,333 |
| Latvians | 99.9 /100 | #43 | Exceptional $67,326 |
| Immigrants | South Africa | 99.9 /100 | #44 | Exceptional $67,234 |
| Immigrants | Afghanistan | 99.8 /100 | #45 | Exceptional $67,007 |
| Cambodians | 99.8 /100 | #46 | Exceptional $66,892 |
| Australians | 99.8 /100 | #47 | Exceptional $66,891 |
| Immigrants | France | 99.8 /100 | #48 | Exceptional $66,826 |
| Immigrants | Indonesia | 99.8 /100 | #49 | Exceptional $66,694 |
| Immigrants | Turkey | 99.7 /100 | #50 | Exceptional $66,672 |
| Israelis | 99.7 /100 | #51 | Exceptional $66,636 |
| Immigrants | Scotland | 99.7 /100 | #52 | Exceptional $66,620 |
| Immigrants | Pakistan | 99.7 /100 | #53 | Exceptional $66,617 |
| Immigrants | Netherlands | 99.7 /100 | #54 | Exceptional $66,463 |