Immigrants from Canada vs Tlingit-Haida Householder Income Over 65 years
COMPARE
Immigrants from Canada
Tlingit-Haida
Householder Income Over 65 years
Householder Income Over 65 years Comparison
Immigrants from Canada
Tlingit-Haida
$64,952
HOUSEHOLDER INCOME OVER 65 YEARS
98.5/ 100
METRIC RATING
77th/ 347
METRIC RANK
$62,922
HOUSEHOLDER INCOME OVER 65 YEARS
88.6/ 100
METRIC RATING
123rd/ 347
METRIC RANK
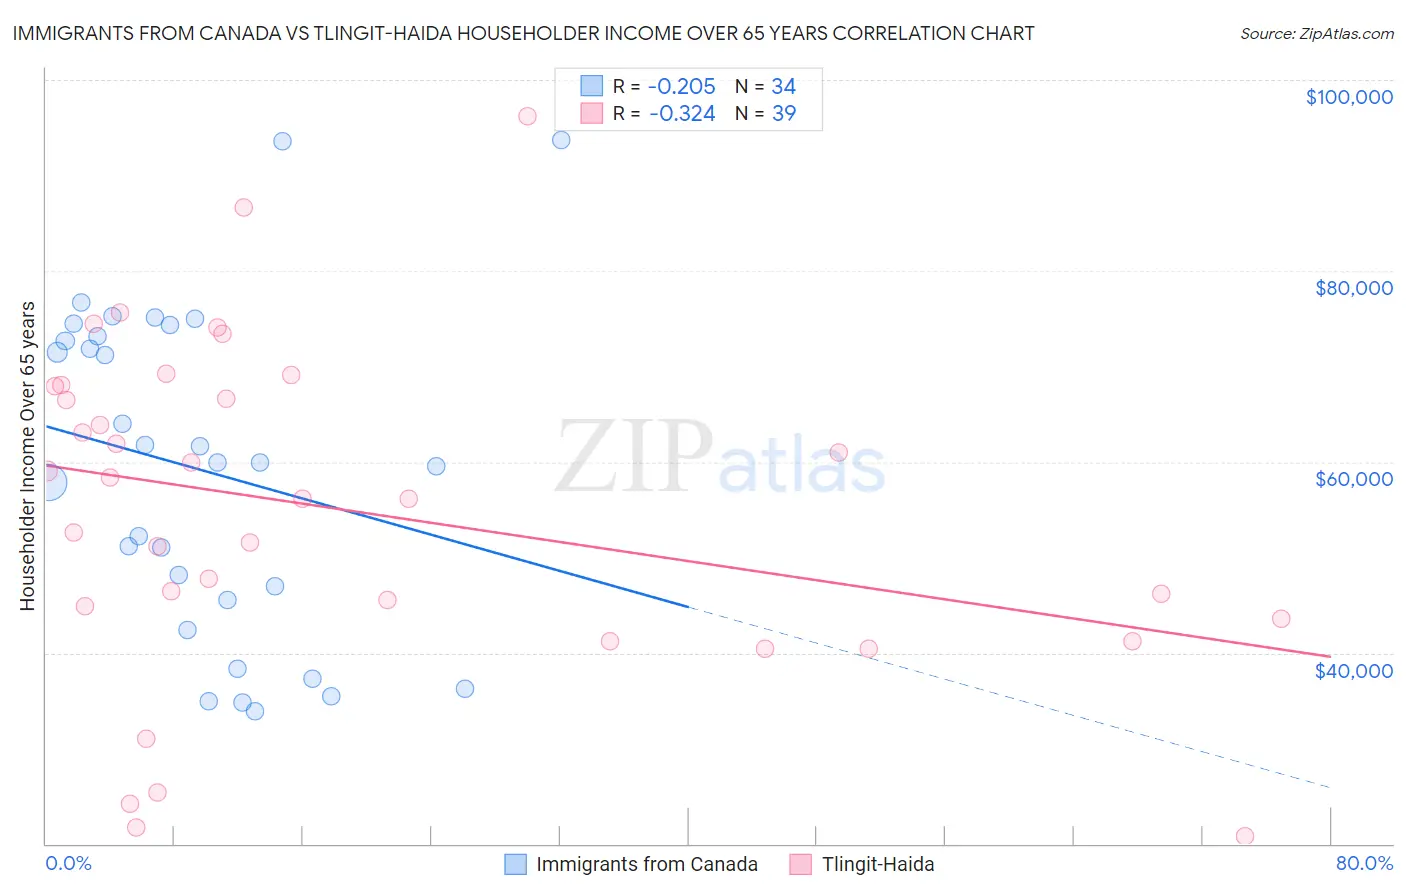
Immigrants from Canada vs Tlingit-Haida Householder Income Over 65 years Correlation Chart
The statistical analysis conducted on geographies consisting of 457,762,448 people shows a weak negative correlation between the proportion of Immigrants from Canada and household income with householder over the age of 65 in the United States with a correlation coefficient (R) of -0.205 and weighted average of $64,952. Similarly, the statistical analysis conducted on geographies consisting of 60,750,081 people shows a mild negative correlation between the proportion of Tlingit-Haida and household income with householder over the age of 65 in the United States with a correlation coefficient (R) of -0.324 and weighted average of $62,922, a difference of 3.2%.
Householder Income Over 65 years Correlation Summary
| Measurement | Immigrants from Canada | Tlingit-Haida |
| Minimum | $33,841 | $20,833 |
| Maximum | $93,750 | $96,250 |
| Range | $59,909 | $75,417 |
| Mean | $59,160 | $54,963 |
| Median | $59,957 | $56,173 |
| Interquartile 25% (IQ1) | $45,537 | $43,571 |
| Interquartile 75% (IQ3) | $73,144 | $67,937 |
| Interquartile Range (IQR) | $27,607 | $24,366 |
| Standard Deviation (Sample) | $16,989 | $17,428 |
| Standard Deviation (Population) | $16,737 | $17,203 |
Similar Demographics by Householder Income Over 65 years
Demographics Similar to Immigrants from Canada by Householder Income Over 65 years
In terms of householder income over 65 years, the demographic groups most similar to Immigrants from Canada are Immigrants from Western Europe ($64,933, a difference of 0.030%), Hawaiian ($64,920, a difference of 0.050%), Ethiopian ($64,989, a difference of 0.060%), Sierra Leonean ($65,038, a difference of 0.13%), and Immigrants from North America ($64,856, a difference of 0.15%).
| Demographics | Rating | Rank | Householder Income Over 65 years |
| Mongolians | 99.0 /100 | #70 | Exceptional $65,326 |
| Greeks | 98.9 /100 | #71 | Exceptional $65,306 |
| Argentineans | 98.9 /100 | #72 | Exceptional $65,246 |
| Immigrants | Ethiopia | 98.9 /100 | #73 | Exceptional $65,238 |
| Lithuanians | 98.8 /100 | #74 | Exceptional $65,209 |
| Sierra Leoneans | 98.6 /100 | #75 | Exceptional $65,038 |
| Ethiopians | 98.5 /100 | #76 | Exceptional $64,989 |
| Immigrants | Canada | 98.5 /100 | #77 | Exceptional $64,952 |
| Immigrants | Western Europe | 98.5 /100 | #78 | Exceptional $64,933 |
| Hawaiians | 98.4 /100 | #79 | Exceptional $64,920 |
| Immigrants | North America | 98.3 /100 | #80 | Exceptional $64,856 |
| Immigrants | Europe | 98.3 /100 | #81 | Exceptional $64,828 |
| Immigrants | Fiji | 98.2 /100 | #82 | Exceptional $64,795 |
| Northern Europeans | 97.9 /100 | #83 | Exceptional $64,658 |
| Immigrants | Greece | 97.9 /100 | #84 | Exceptional $64,636 |
Demographics Similar to Tlingit-Haida by Householder Income Over 65 years
In terms of householder income over 65 years, the demographic groups most similar to Tlingit-Haida are Immigrants from Moldova ($62,939, a difference of 0.030%), Taiwanese ($62,894, a difference of 0.040%), Soviet Union ($62,848, a difference of 0.12%), Immigrants from Vietnam ($63,014, a difference of 0.15%), and Ukrainian ($63,032, a difference of 0.18%).
| Demographics | Rating | Rank | Householder Income Over 65 years |
| Guamanians/Chamorros | 91.1 /100 | #116 | Exceptional $63,187 |
| Immigrants | Croatia | 90.9 /100 | #117 | Exceptional $63,168 |
| Danes | 90.5 /100 | #118 | Exceptional $63,117 |
| Immigrants | Jordan | 89.8 /100 | #119 | Excellent $63,041 |
| Ukrainians | 89.7 /100 | #120 | Excellent $63,032 |
| Immigrants | Vietnam | 89.5 /100 | #121 | Excellent $63,014 |
| Immigrants | Moldova | 88.7 /100 | #122 | Excellent $62,939 |
| Tlingit-Haida | 88.6 /100 | #123 | Excellent $62,922 |
| Taiwanese | 88.3 /100 | #124 | Excellent $62,894 |
| Soviet Union | 87.8 /100 | #125 | Excellent $62,848 |
| Peruvians | 86.8 /100 | #126 | Excellent $62,766 |
| Swedes | 86.4 /100 | #127 | Excellent $62,736 |
| Aleuts | 86.1 /100 | #128 | Excellent $62,708 |
| Immigrants | Eastern Europe | 85.9 /100 | #129 | Excellent $62,693 |
| Basques | 85.4 /100 | #130 | Excellent $62,653 |