Immigrants from Canada vs Australian Single Mother Poverty
COMPARE
Immigrants from Canada
Australian
Single Mother Poverty
Single Mother Poverty Comparison
Immigrants from Canada
Australians
28.4%
SINGLE MOTHER POVERTY
88.9/ 100
METRIC RATING
137th/ 347
METRIC RANK
28.3%
SINGLE MOTHER POVERTY
92.5/ 100
METRIC RATING
117th/ 347
METRIC RANK
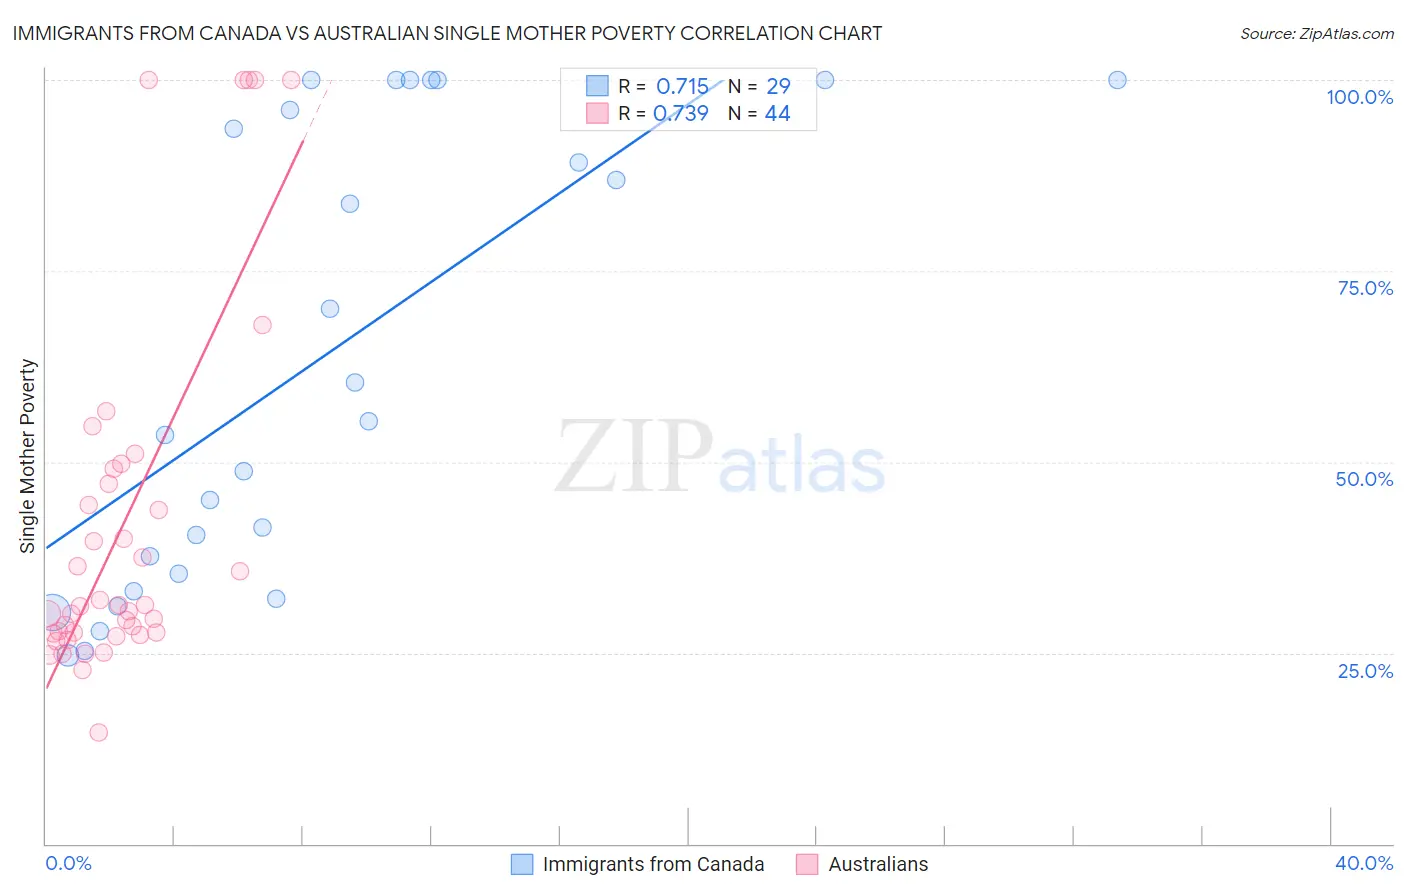
Immigrants from Canada vs Australian Single Mother Poverty Correlation Chart
The statistical analysis conducted on geographies consisting of 443,447,925 people shows a strong positive correlation between the proportion of Immigrants from Canada and poverty level among single mothers in the United States with a correlation coefficient (R) of 0.715 and weighted average of 28.4%. Similarly, the statistical analysis conducted on geographies consisting of 220,322,695 people shows a strong positive correlation between the proportion of Australians and poverty level among single mothers in the United States with a correlation coefficient (R) of 0.739 and weighted average of 28.3%, a difference of 0.53%.
Single Mother Poverty Correlation Summary
| Measurement | Immigrants from Canada | Australian |
| Minimum | 24.7% | 14.5% |
| Maximum | 100.0% | 100.0% |
| Range | 75.3% | 85.5% |
| Mean | 63.5% | 41.8% |
| Median | 55.4% | 31.2% |
| Interquartile 25% (IQ1) | 34.3% | 27.6% |
| Interquartile 75% (IQ3) | 98.0% | 48.1% |
| Interquartile Range (IQR) | 63.8% | 20.5% |
| Standard Deviation (Sample) | 29.6% | 23.5% |
| Standard Deviation (Population) | 29.1% | 23.2% |
Demographics Similar to Immigrants from Canada and Australians by Single Mother Poverty
In terms of single mother poverty, the demographic groups most similar to Immigrants from Canada are Native Hawaiian (28.4%, a difference of 0.0%), Immigrants from Southern Europe (28.4%, a difference of 0.040%), Immigrants from Spain (28.4%, a difference of 0.040%), Immigrants from Morocco (28.4%, a difference of 0.070%), and Swedish (28.4%, a difference of 0.070%). Similarly, the demographic groups most similar to Australians are Brazilian (28.3%, a difference of 0.010%), Immigrants from Syria (28.3%, a difference of 0.020%), Cypriot (28.3%, a difference of 0.040%), Immigrants from Afghanistan (28.3%, a difference of 0.080%), and Colombian (28.3%, a difference of 0.13%).
| Demographics | Rating | Rank | Single Mother Poverty |
| Australians | 92.5 /100 | #117 | Exceptional 28.3% |
| Brazilians | 92.4 /100 | #118 | Exceptional 28.3% |
| Immigrants | Syria | 92.4 /100 | #119 | Exceptional 28.3% |
| Cypriots | 92.3 /100 | #120 | Exceptional 28.3% |
| Immigrants | Afghanistan | 92.1 /100 | #121 | Exceptional 28.3% |
| Colombians | 91.8 /100 | #122 | Exceptional 28.3% |
| Uruguayans | 91.7 /100 | #123 | Exceptional 28.3% |
| Immigrants | Switzerland | 91.7 /100 | #124 | Exceptional 28.3% |
| Kenyans | 90.9 /100 | #125 | Exceptional 28.4% |
| Immigrants | Chile | 90.8 /100 | #126 | Exceptional 28.4% |
| Poles | 90.8 /100 | #127 | Exceptional 28.4% |
| Immigrants | England | 90.5 /100 | #128 | Exceptional 28.4% |
| South Americans | 90.4 /100 | #129 | Exceptional 28.4% |
| Norwegians | 90.4 /100 | #130 | Exceptional 28.4% |
| Immigrants | Austria | 90.3 /100 | #131 | Exceptional 28.4% |
| Immigrants | Morocco | 89.5 /100 | #132 | Excellent 28.4% |
| Swedes | 89.4 /100 | #133 | Excellent 28.4% |
| Immigrants | Southern Europe | 89.2 /100 | #134 | Excellent 28.4% |
| Immigrants | Spain | 89.2 /100 | #135 | Excellent 28.4% |
| Native Hawaiians | 88.9 /100 | #136 | Excellent 28.4% |
| Immigrants | Canada | 88.9 /100 | #137 | Excellent 28.4% |