Immigrants from Bulgaria vs German Median Female Earnings
COMPARE
Immigrants from Bulgaria
German
Median Female Earnings
Median Female Earnings Comparison
Immigrants from Bulgaria
Germans
$43,085
MEDIAN FEMALE EARNINGS
99.9/ 100
METRIC RATING
61st/ 347
METRIC RANK
$37,986
MEDIAN FEMALE EARNINGS
2.8/ 100
METRIC RATING
243rd/ 347
METRIC RANK
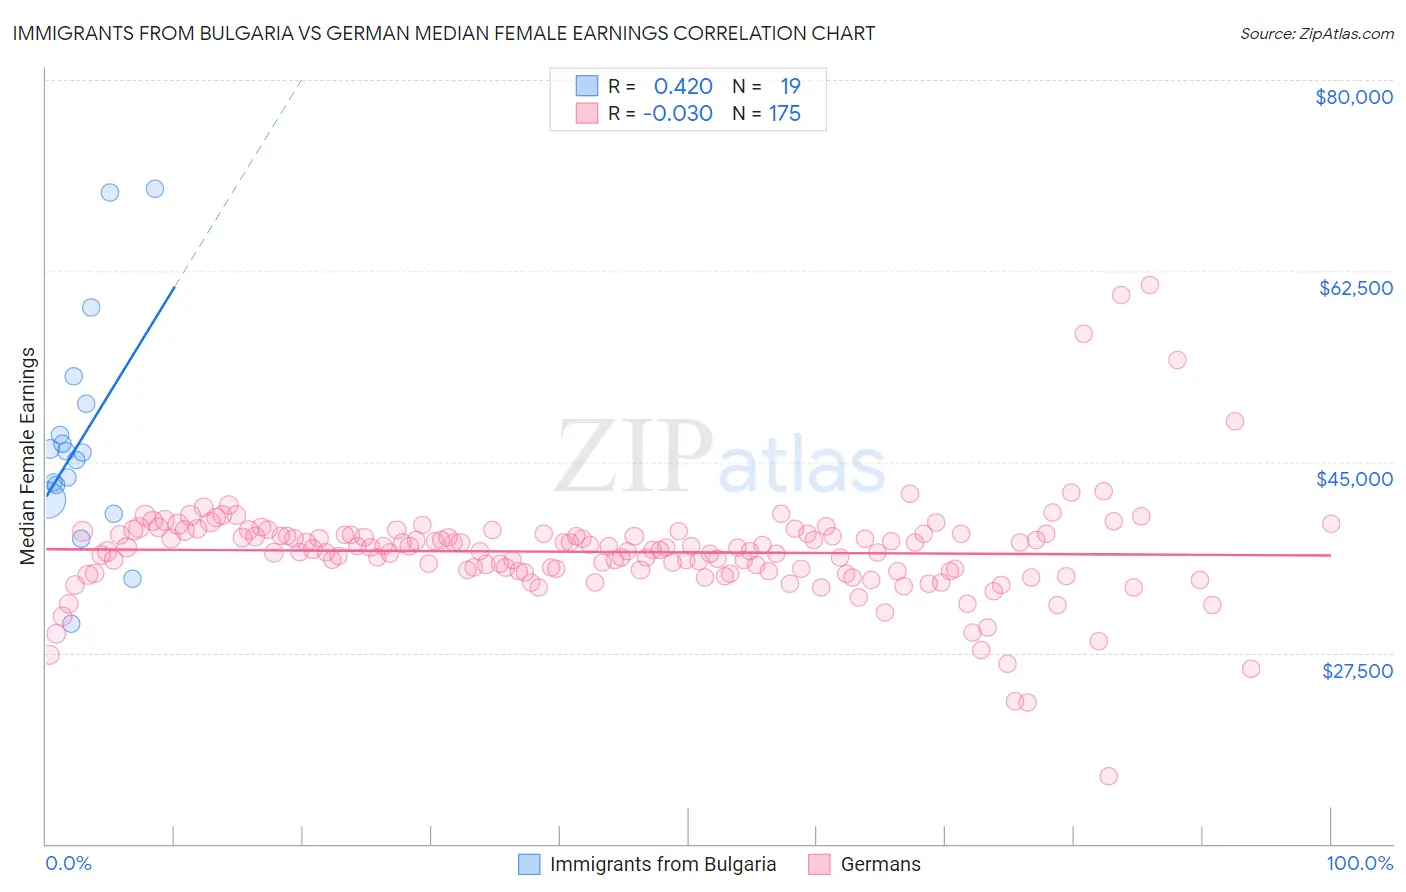
Immigrants from Bulgaria vs German Median Female Earnings Correlation Chart
The statistical analysis conducted on geographies consisting of 172,533,051 people shows a moderate positive correlation between the proportion of Immigrants from Bulgaria and median female earnings in the United States with a correlation coefficient (R) of 0.420 and weighted average of $43,085. Similarly, the statistical analysis conducted on geographies consisting of 578,410,378 people shows no correlation between the proportion of Germans and median female earnings in the United States with a correlation coefficient (R) of -0.030 and weighted average of $37,986, a difference of 13.4%.
Median Female Earnings Correlation Summary
| Measurement | Immigrants from Bulgaria | German |
| Minimum | $30,131 | $16,161 |
| Maximum | $70,060 | $61,250 |
| Range | $39,929 | $45,089 |
| Mean | $47,007 | $36,748 |
| Median | $45,854 | $36,985 |
| Interquartile 25% (IQ1) | $41,489 | $34,926 |
| Interquartile 75% (IQ3) | $50,302 | $38,384 |
| Interquartile Range (IQR) | $8,813 | $3,458 |
| Standard Deviation (Sample) | $10,260 | $4,922 |
| Standard Deviation (Population) | $9,987 | $4,908 |
Similar Demographics by Median Female Earnings
Demographics Similar to Immigrants from Bulgaria by Median Female Earnings
In terms of median female earnings, the demographic groups most similar to Immigrants from Bulgaria are Afghan ($43,077, a difference of 0.020%), Immigrants from Latvia ($43,099, a difference of 0.030%), Immigrants from Ukraine ($43,069, a difference of 0.040%), Estonian ($43,106, a difference of 0.050%), and Immigrants from Pakistan ($43,052, a difference of 0.080%).
| Demographics | Rating | Rank | Median Female Earnings |
| Australians | 99.9 /100 | #54 | Exceptional $43,308 |
| Egyptians | 99.9 /100 | #55 | Exceptional $43,305 |
| Immigrants | Croatia | 99.9 /100 | #56 | Exceptional $43,258 |
| Ethiopians | 99.9 /100 | #57 | Exceptional $43,243 |
| Paraguayans | 99.9 /100 | #58 | Exceptional $43,173 |
| Estonians | 99.9 /100 | #59 | Exceptional $43,106 |
| Immigrants | Latvia | 99.9 /100 | #60 | Exceptional $43,099 |
| Immigrants | Bulgaria | 99.9 /100 | #61 | Exceptional $43,085 |
| Afghans | 99.9 /100 | #62 | Exceptional $43,077 |
| Immigrants | Ukraine | 99.9 /100 | #63 | Exceptional $43,069 |
| Immigrants | Pakistan | 99.9 /100 | #64 | Exceptional $43,052 |
| Sierra Leoneans | 99.9 /100 | #65 | Exceptional $42,868 |
| Immigrants | Norway | 99.9 /100 | #66 | Exceptional $42,837 |
| Immigrants | Egypt | 99.9 /100 | #67 | Exceptional $42,837 |
| Immigrants | Austria | 99.8 /100 | #68 | Exceptional $42,824 |
Demographics Similar to Germans by Median Female Earnings
In terms of median female earnings, the demographic groups most similar to Germans are Immigrants from Liberia ($37,970, a difference of 0.040%), Immigrants from Middle Africa ($37,965, a difference of 0.050%), Delaware ($37,964, a difference of 0.060%), Immigrants from Burma/Myanmar ($38,028, a difference of 0.11%), and Immigrants from Somalia ($37,914, a difference of 0.19%).
| Demographics | Rating | Rank | Median Female Earnings |
| Liberians | 4.4 /100 | #236 | Tragic $38,215 |
| Immigrants | Cabo Verde | 4.3 /100 | #237 | Tragic $38,208 |
| Alaska Natives | 4.3 /100 | #238 | Tragic $38,202 |
| English | 4.2 /100 | #239 | Tragic $38,196 |
| Finns | 4.0 /100 | #240 | Tragic $38,173 |
| Spanish | 3.5 /100 | #241 | Tragic $38,098 |
| Immigrants | Burma/Myanmar | 3.0 /100 | #242 | Tragic $38,028 |
| Germans | 2.8 /100 | #243 | Tragic $37,986 |
| Immigrants | Liberia | 2.7 /100 | #244 | Tragic $37,970 |
| Immigrants | Middle Africa | 2.7 /100 | #245 | Tragic $37,965 |
| Delaware | 2.6 /100 | #246 | Tragic $37,964 |
| Immigrants | Somalia | 2.4 /100 | #247 | Tragic $37,914 |
| Alaskan Athabascans | 2.3 /100 | #248 | Tragic $37,905 |
| Swiss | 2.3 /100 | #249 | Tragic $37,904 |
| Immigrants | Iraq | 2.2 /100 | #250 | Tragic $37,864 |