Immigrants from Brazil vs Cape Verdean Median Male Earnings
COMPARE
Immigrants from Brazil
Cape Verdean
Median Male Earnings
Median Male Earnings Comparison
Immigrants from Brazil
Cape Verdeans
$58,324
MEDIAN MALE EARNINGS
97.7/ 100
METRIC RATING
101st/ 347
METRIC RANK
$51,103
MEDIAN MALE EARNINGS
3.5/ 100
METRIC RATING
234th/ 347
METRIC RANK
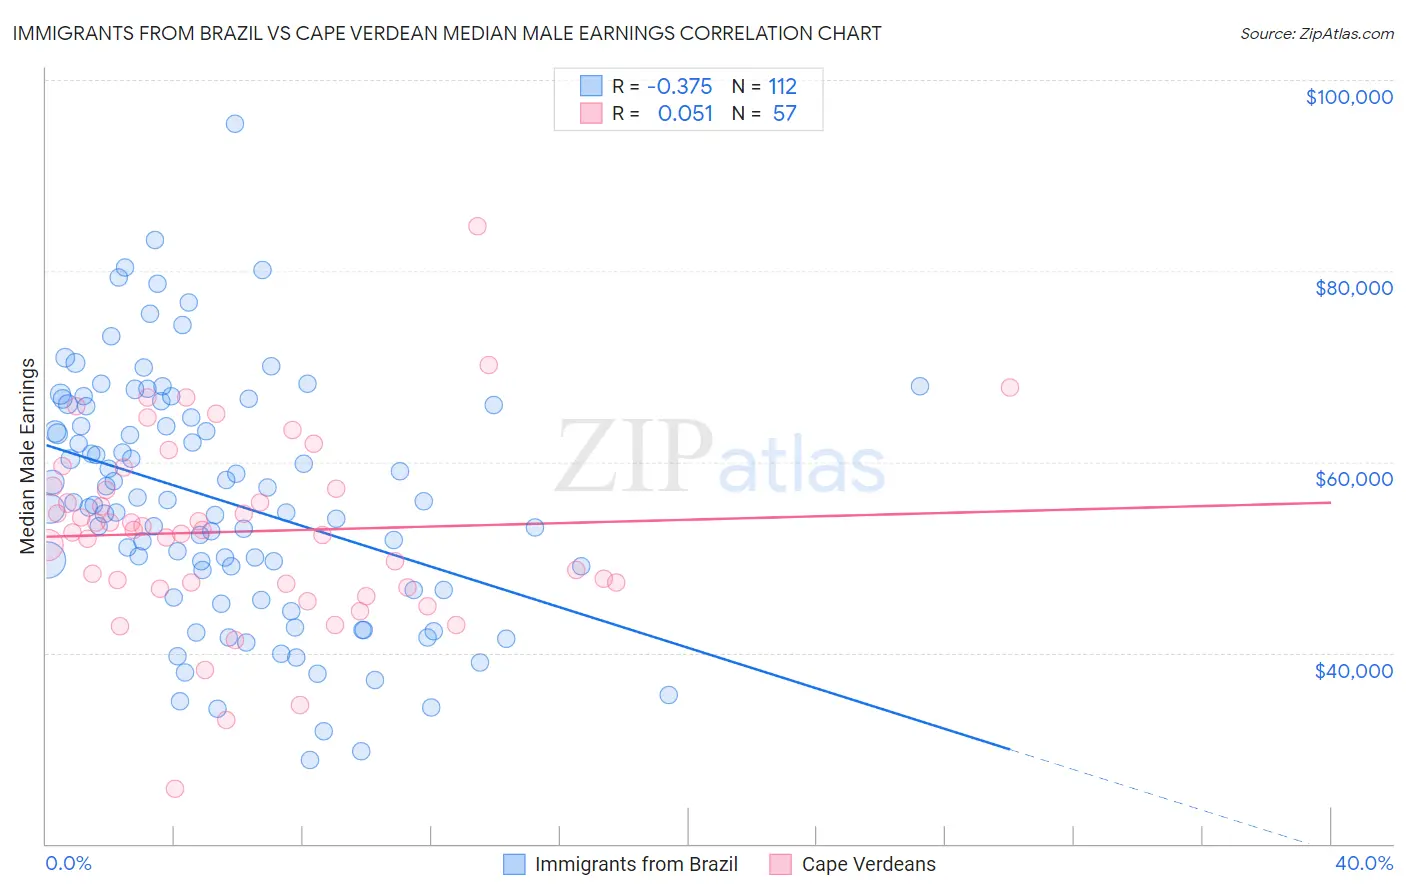
Immigrants from Brazil vs Cape Verdean Median Male Earnings Correlation Chart
The statistical analysis conducted on geographies consisting of 342,925,188 people shows a mild negative correlation between the proportion of Immigrants from Brazil and median male earnings in the United States with a correlation coefficient (R) of -0.375 and weighted average of $58,324. Similarly, the statistical analysis conducted on geographies consisting of 107,567,026 people shows a slight positive correlation between the proportion of Cape Verdeans and median male earnings in the United States with a correlation coefficient (R) of 0.051 and weighted average of $51,103, a difference of 14.1%.
Median Male Earnings Correlation Summary
| Measurement | Immigrants from Brazil | Cape Verdean |
| Minimum | $28,750 | $25,819 |
| Maximum | $95,391 | $84,702 |
| Range | $66,641 | $58,883 |
| Mean | $55,921 | $52,707 |
| Median | $55,594 | $52,842 |
| Interquartile 25% (IQ1) | $46,610 | $47,020 |
| Interquartile 75% (IQ3) | $65,884 | $57,300 |
| Interquartile Range (IQR) | $19,274 | $10,280 |
| Standard Deviation (Sample) | $12,788 | $9,854 |
| Standard Deviation (Population) | $12,730 | $9,767 |
Similar Demographics by Median Male Earnings
Demographics Similar to Immigrants from Brazil by Median Male Earnings
In terms of median male earnings, the demographic groups most similar to Immigrants from Brazil are Assyrian/Chaldean/Syriac ($58,437, a difference of 0.19%), Immigrants from Poland ($58,452, a difference of 0.22%), Syrian ($58,187, a difference of 0.24%), Jordanian ($58,500, a difference of 0.30%), and Polish ($58,139, a difference of 0.32%).
| Demographics | Rating | Rank | Median Male Earnings |
| Immigrants | North Macedonia | 99.0 /100 | #94 | Exceptional $59,189 |
| Immigrants | Lebanon | 98.6 /100 | #95 | Exceptional $58,835 |
| Albanians | 98.4 /100 | #96 | Exceptional $58,680 |
| Northern Europeans | 98.2 /100 | #97 | Exceptional $58,588 |
| Jordanians | 98.1 /100 | #98 | Exceptional $58,500 |
| Immigrants | Poland | 98.0 /100 | #99 | Exceptional $58,452 |
| Assyrians/Chaldeans/Syriacs | 97.9 /100 | #100 | Exceptional $58,437 |
| Immigrants | Brazil | 97.7 /100 | #101 | Exceptional $58,324 |
| Syrians | 97.4 /100 | #102 | Exceptional $58,187 |
| Poles | 97.3 /100 | #103 | Exceptional $58,139 |
| Armenians | 97.3 /100 | #104 | Exceptional $58,134 |
| Immigrants | Western Asia | 97.3 /100 | #105 | Exceptional $58,131 |
| Immigrants | Northern Africa | 96.9 /100 | #106 | Exceptional $58,008 |
| Serbians | 96.8 /100 | #107 | Exceptional $57,975 |
| Immigrants | Uzbekistan | 96.7 /100 | #108 | Exceptional $57,941 |
Demographics Similar to Cape Verdeans by Median Male Earnings
In terms of median male earnings, the demographic groups most similar to Cape Verdeans are Aleut ($51,168, a difference of 0.13%), Sudanese ($51,216, a difference of 0.22%), Barbadian ($51,236, a difference of 0.26%), Immigrants from Western Africa ($50,940, a difference of 0.32%), and Immigrants from Nigeria ($51,310, a difference of 0.40%).
| Demographics | Rating | Rank | Median Male Earnings |
| Trinidadians and Tobagonians | 4.8 /100 | #227 | Tragic $51,446 |
| Samoans | 4.6 /100 | #228 | Tragic $51,389 |
| Immigrants | Trinidad and Tobago | 4.5 /100 | #229 | Tragic $51,376 |
| Immigrants | Nigeria | 4.2 /100 | #230 | Tragic $51,310 |
| Barbadians | 3.9 /100 | #231 | Tragic $51,236 |
| Sudanese | 3.9 /100 | #232 | Tragic $51,216 |
| Aleuts | 3.7 /100 | #233 | Tragic $51,168 |
| Cape Verdeans | 3.5 /100 | #234 | Tragic $51,103 |
| Immigrants | Western Africa | 3.0 /100 | #235 | Tragic $50,940 |
| Pennsylvania Germans | 2.8 /100 | #236 | Tragic $50,878 |
| Immigrants | Barbados | 2.6 /100 | #237 | Tragic $50,795 |
| Malaysians | 2.5 /100 | #238 | Tragic $50,772 |
| Americans | 2.5 /100 | #239 | Tragic $50,761 |
| West Indians | 2.3 /100 | #240 | Tragic $50,682 |
| Immigrants | St. Vincent and the Grenadines | 2.3 /100 | #241 | Tragic $50,665 |