Immigrants from Belize vs Ukrainian Median Earnings
COMPARE
Immigrants from Belize
Ukrainian
Median Earnings
Median Earnings Comparison
Immigrants from Belize
Ukrainians
$42,339
MEDIAN EARNINGS
0.3/ 100
METRIC RATING
275th/ 347
METRIC RANK
$50,320
MEDIAN EARNINGS
99.6/ 100
METRIC RATING
80th/ 347
METRIC RANK
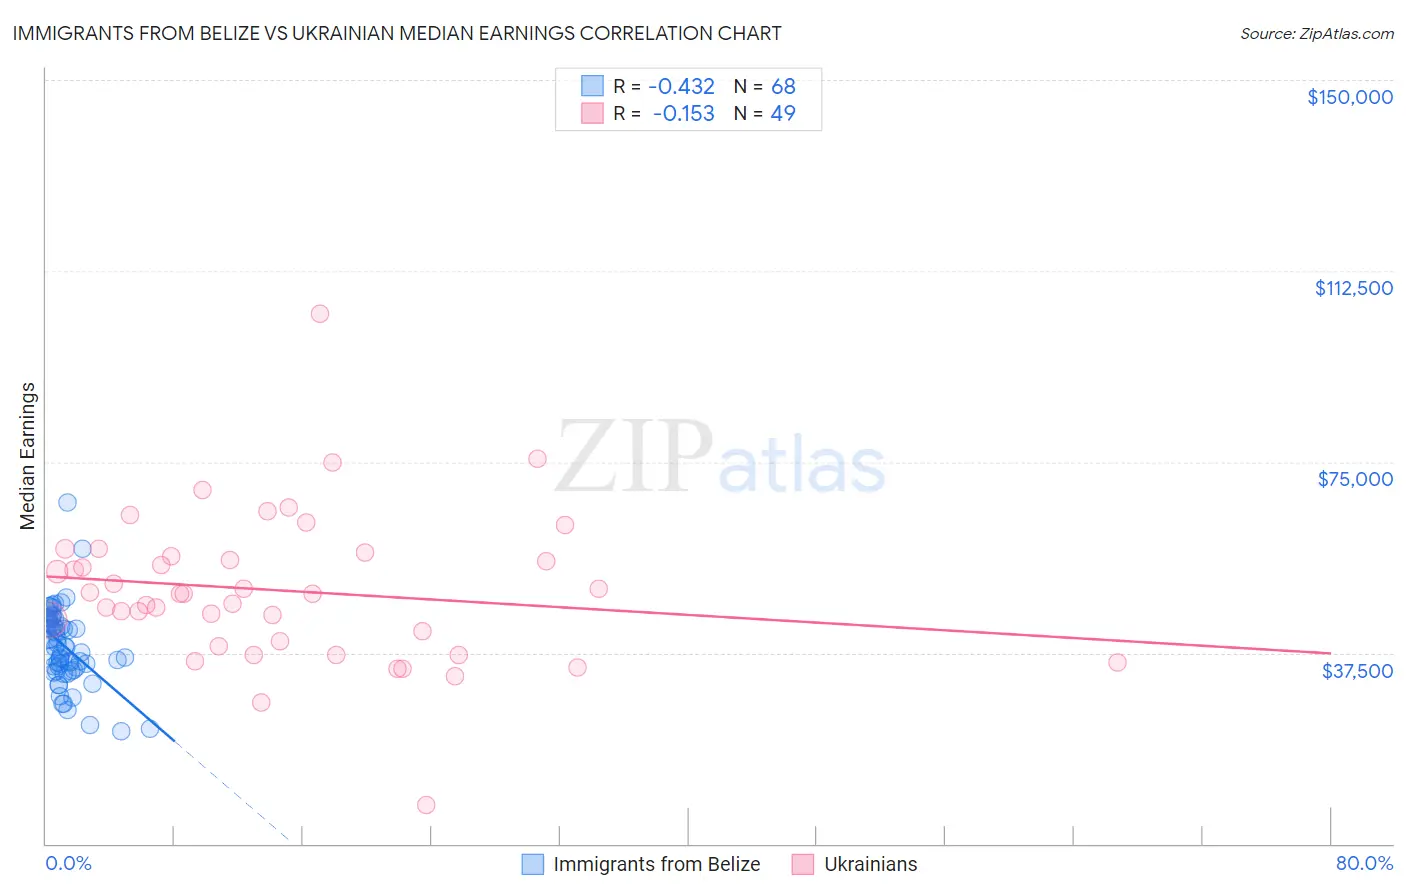
Immigrants from Belize vs Ukrainian Median Earnings Correlation Chart
The statistical analysis conducted on geographies consisting of 130,311,555 people shows a moderate negative correlation between the proportion of Immigrants from Belize and median earnings in the United States with a correlation coefficient (R) of -0.432 and weighted average of $42,339. Similarly, the statistical analysis conducted on geographies consisting of 448,668,422 people shows a poor negative correlation between the proportion of Ukrainians and median earnings in the United States with a correlation coefficient (R) of -0.153 and weighted average of $50,320, a difference of 18.9%.
Median Earnings Correlation Summary
| Measurement | Immigrants from Belize | Ukrainian |
| Minimum | $22,042 | $7,500 |
| Maximum | $66,975 | $104,015 |
| Range | $44,933 | $96,515 |
| Mean | $38,697 | $49,735 |
| Median | $38,598 | $49,200 |
| Interquartile 25% (IQ1) | $34,404 | $39,295 |
| Interquartile 75% (IQ3) | $43,711 | $56,811 |
| Interquartile Range (IQR) | $9,306 | $17,516 |
| Standard Deviation (Sample) | $7,646 | $14,902 |
| Standard Deviation (Population) | $7,590 | $14,749 |
Similar Demographics by Median Earnings
Demographics Similar to Immigrants from Belize by Median Earnings
In terms of median earnings, the demographic groups most similar to Immigrants from Belize are Spanish American ($42,316, a difference of 0.060%), Central American ($42,280, a difference of 0.14%), Immigrants from El Salvador ($42,413, a difference of 0.18%), Immigrants from Dominica ($42,420, a difference of 0.19%), and Iroquois ($42,430, a difference of 0.22%).
| Demographics | Rating | Rank | Median Earnings |
| Americans | 0.6 /100 | #268 | Tragic $42,742 |
| Belizeans | 0.5 /100 | #269 | Tragic $42,702 |
| Osage | 0.5 /100 | #270 | Tragic $42,651 |
| Pennsylvania Germans | 0.5 /100 | #271 | Tragic $42,615 |
| Iroquois | 0.4 /100 | #272 | Tragic $42,430 |
| Immigrants | Dominica | 0.4 /100 | #273 | Tragic $42,420 |
| Immigrants | El Salvador | 0.4 /100 | #274 | Tragic $42,413 |
| Immigrants | Belize | 0.3 /100 | #275 | Tragic $42,339 |
| Spanish Americans | 0.3 /100 | #276 | Tragic $42,316 |
| Central Americans | 0.3 /100 | #277 | Tragic $42,280 |
| Cajuns | 0.3 /100 | #278 | Tragic $42,189 |
| Colville | 0.2 /100 | #279 | Tragic $42,151 |
| Hmong | 0.2 /100 | #280 | Tragic $42,111 |
| Marshallese | 0.2 /100 | #281 | Tragic $41,969 |
| Africans | 0.2 /100 | #282 | Tragic $41,955 |
Demographics Similar to Ukrainians by Median Earnings
In terms of median earnings, the demographic groups most similar to Ukrainians are Laotian ($50,343, a difference of 0.050%), Immigrants from Southern Europe ($50,280, a difference of 0.080%), Immigrants from Moldova ($50,274, a difference of 0.090%), Romanian ($50,244, a difference of 0.15%), and Argentinean ($50,399, a difference of 0.16%).
| Demographics | Rating | Rank | Median Earnings |
| Immigrants | Netherlands | 99.8 /100 | #73 | Exceptional $50,818 |
| South Africans | 99.8 /100 | #74 | Exceptional $50,752 |
| Immigrants | Scotland | 99.8 /100 | #75 | Exceptional $50,741 |
| Immigrants | Italy | 99.7 /100 | #76 | Exceptional $50,581 |
| Immigrants | Western Europe | 99.7 /100 | #77 | Exceptional $50,549 |
| Argentineans | 99.6 /100 | #78 | Exceptional $50,399 |
| Laotians | 99.6 /100 | #79 | Exceptional $50,343 |
| Ukrainians | 99.6 /100 | #80 | Exceptional $50,320 |
| Immigrants | Southern Europe | 99.6 /100 | #81 | Exceptional $50,280 |
| Immigrants | Moldova | 99.5 /100 | #82 | Exceptional $50,274 |
| Romanians | 99.5 /100 | #83 | Exceptional $50,244 |
| Immigrants | Hungary | 99.5 /100 | #84 | Exceptional $50,227 |
| Immigrants | Kazakhstan | 99.5 /100 | #85 | Exceptional $50,225 |
| Immigrants | Canada | 99.5 /100 | #86 | Exceptional $50,192 |
| Immigrants | Uzbekistan | 99.5 /100 | #87 | Exceptional $50,151 |