Syrian vs Ukrainian Median Earnings
COMPARE
Syrian
Ukrainian
Median Earnings
Median Earnings Comparison
Syrians
Ukrainians
$48,934
MEDIAN EARNINGS
97.1/ 100
METRIC RATING
109th/ 347
METRIC RANK
$50,320
MEDIAN EARNINGS
99.6/ 100
METRIC RATING
80th/ 347
METRIC RANK
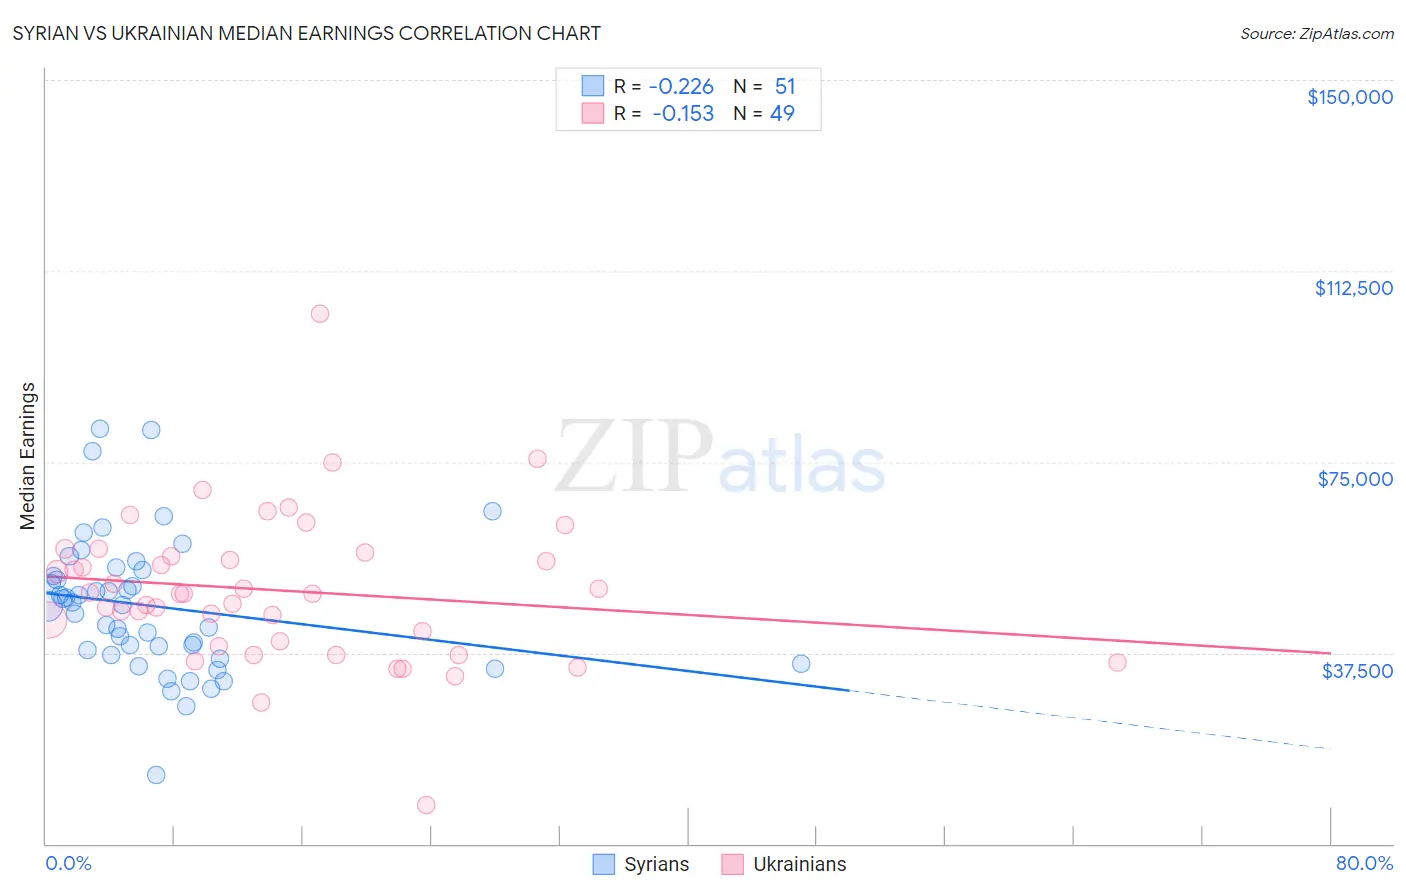
Syrian vs Ukrainian Median Earnings Correlation Chart
The statistical analysis conducted on geographies consisting of 266,312,508 people shows a weak negative correlation between the proportion of Syrians and median earnings in the United States with a correlation coefficient (R) of -0.226 and weighted average of $48,934. Similarly, the statistical analysis conducted on geographies consisting of 448,668,422 people shows a poor negative correlation between the proportion of Ukrainians and median earnings in the United States with a correlation coefficient (R) of -0.153 and weighted average of $50,320, a difference of 2.8%.
Median Earnings Correlation Summary
| Measurement | Syrian | Ukrainian |
| Minimum | $13,611 | $7,500 |
| Maximum | $81,610 | $104,015 |
| Range | $67,999 | $96,515 |
| Mean | $46,643 | $49,735 |
| Median | $46,804 | $49,200 |
| Interquartile 25% (IQ1) | $37,007 | $39,295 |
| Interquartile 75% (IQ3) | $53,802 | $56,811 |
| Interquartile Range (IQR) | $16,795 | $17,516 |
| Standard Deviation (Sample) | $13,425 | $14,902 |
| Standard Deviation (Population) | $13,293 | $14,749 |
Similar Demographics by Median Earnings
Demographics Similar to Syrians by Median Earnings
In terms of median earnings, the demographic groups most similar to Syrians are Immigrants from Ethiopia ($48,924, a difference of 0.020%), Immigrants from Zimbabwe ($48,913, a difference of 0.040%), Northern European ($48,887, a difference of 0.10%), Immigrants from Kuwait ($48,861, a difference of 0.15%), and Moroccan ($48,838, a difference of 0.20%).
| Demographics | Rating | Rank | Median Earnings |
| Ethiopians | 98.8 /100 | #102 | Exceptional $49,572 |
| Austrians | 98.7 /100 | #103 | Exceptional $49,501 |
| Immigrants | Brazil | 98.6 /100 | #104 | Exceptional $49,463 |
| Immigrants | Western Asia | 98.4 /100 | #105 | Exceptional $49,389 |
| Immigrants | Albania | 98.4 /100 | #106 | Exceptional $49,377 |
| Immigrants | Morocco | 98.4 /100 | #107 | Exceptional $49,368 |
| Palestinians | 98.0 /100 | #108 | Exceptional $49,209 |
| Syrians | 97.1 /100 | #109 | Exceptional $48,934 |
| Immigrants | Ethiopia | 97.1 /100 | #110 | Exceptional $48,924 |
| Immigrants | Zimbabwe | 97.0 /100 | #111 | Exceptional $48,913 |
| Northern Europeans | 96.9 /100 | #112 | Exceptional $48,887 |
| Immigrants | Kuwait | 96.8 /100 | #113 | Exceptional $48,861 |
| Moroccans | 96.7 /100 | #114 | Exceptional $48,838 |
| Chinese | 96.7 /100 | #115 | Exceptional $48,836 |
| Koreans | 96.2 /100 | #116 | Exceptional $48,727 |
Demographics Similar to Ukrainians by Median Earnings
In terms of median earnings, the demographic groups most similar to Ukrainians are Laotian ($50,343, a difference of 0.050%), Immigrants from Southern Europe ($50,280, a difference of 0.080%), Immigrants from Moldova ($50,274, a difference of 0.090%), Romanian ($50,244, a difference of 0.15%), and Argentinean ($50,399, a difference of 0.16%).
| Demographics | Rating | Rank | Median Earnings |
| Immigrants | Netherlands | 99.8 /100 | #73 | Exceptional $50,818 |
| South Africans | 99.8 /100 | #74 | Exceptional $50,752 |
| Immigrants | Scotland | 99.8 /100 | #75 | Exceptional $50,741 |
| Immigrants | Italy | 99.7 /100 | #76 | Exceptional $50,581 |
| Immigrants | Western Europe | 99.7 /100 | #77 | Exceptional $50,549 |
| Argentineans | 99.6 /100 | #78 | Exceptional $50,399 |
| Laotians | 99.6 /100 | #79 | Exceptional $50,343 |
| Ukrainians | 99.6 /100 | #80 | Exceptional $50,320 |
| Immigrants | Southern Europe | 99.6 /100 | #81 | Exceptional $50,280 |
| Immigrants | Moldova | 99.5 /100 | #82 | Exceptional $50,274 |
| Romanians | 99.5 /100 | #83 | Exceptional $50,244 |
| Immigrants | Hungary | 99.5 /100 | #84 | Exceptional $50,227 |
| Immigrants | Kazakhstan | 99.5 /100 | #85 | Exceptional $50,225 |
| Immigrants | Canada | 99.5 /100 | #86 | Exceptional $50,192 |
| Immigrants | Uzbekistan | 99.5 /100 | #87 | Exceptional $50,151 |