Immigrants from Belize vs Hmong Median Earnings
COMPARE
Immigrants from Belize
Hmong
Median Earnings
Median Earnings Comparison
Immigrants from Belize
Hmong
$42,339
MEDIAN EARNINGS
0.3/ 100
METRIC RATING
275th/ 347
METRIC RANK
$42,111
MEDIAN EARNINGS
0.2/ 100
METRIC RATING
280th/ 347
METRIC RANK
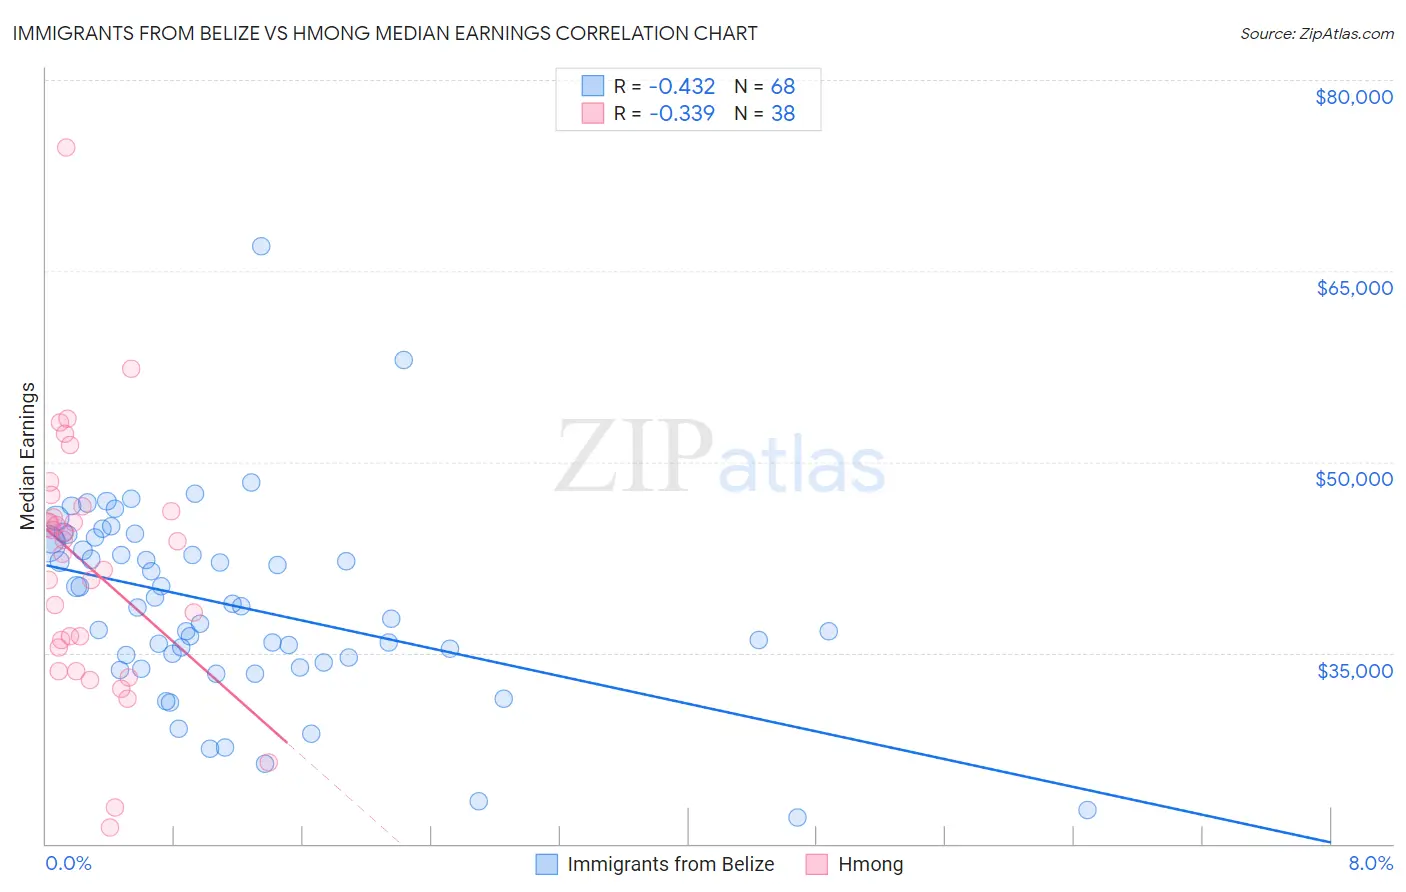
Immigrants from Belize vs Hmong Median Earnings Correlation Chart
The statistical analysis conducted on geographies consisting of 130,311,555 people shows a moderate negative correlation between the proportion of Immigrants from Belize and median earnings in the United States with a correlation coefficient (R) of -0.432 and weighted average of $42,339. Similarly, the statistical analysis conducted on geographies consisting of 24,671,308 people shows a mild negative correlation between the proportion of Hmong and median earnings in the United States with a correlation coefficient (R) of -0.339 and weighted average of $42,111, a difference of 0.54%.
Median Earnings Correlation Summary
| Measurement | Immigrants from Belize | Hmong |
| Minimum | $22,042 | $21,250 |
| Maximum | $66,975 | $74,741 |
| Range | $44,933 | $53,491 |
| Mean | $38,697 | $41,764 |
| Median | $38,598 | $43,269 |
| Interquartile 25% (IQ1) | $34,404 | $35,451 |
| Interquartile 75% (IQ3) | $43,711 | $46,136 |
| Interquartile Range (IQR) | $9,306 | $10,685 |
| Standard Deviation (Sample) | $7,646 | $9,945 |
| Standard Deviation (Population) | $7,590 | $9,814 |
Demographics Similar to Immigrants from Belize and Hmong by Median Earnings
In terms of median earnings, the demographic groups most similar to Immigrants from Belize are Spanish American ($42,316, a difference of 0.060%), Central American ($42,280, a difference of 0.14%), Immigrants from El Salvador ($42,413, a difference of 0.18%), Immigrants from Dominica ($42,420, a difference of 0.19%), and Iroquois ($42,430, a difference of 0.22%). Similarly, the demographic groups most similar to Hmong are Colville ($42,151, a difference of 0.10%), Cajun ($42,189, a difference of 0.19%), Marshallese ($41,969, a difference of 0.34%), African ($41,955, a difference of 0.37%), and Central American ($42,280, a difference of 0.40%).
| Demographics | Rating | Rank | Median Earnings |
| Cree | 0.6 /100 | #267 | Tragic $42,777 |
| Americans | 0.6 /100 | #268 | Tragic $42,742 |
| Belizeans | 0.5 /100 | #269 | Tragic $42,702 |
| Osage | 0.5 /100 | #270 | Tragic $42,651 |
| Pennsylvania Germans | 0.5 /100 | #271 | Tragic $42,615 |
| Iroquois | 0.4 /100 | #272 | Tragic $42,430 |
| Immigrants | Dominica | 0.4 /100 | #273 | Tragic $42,420 |
| Immigrants | El Salvador | 0.4 /100 | #274 | Tragic $42,413 |
| Immigrants | Belize | 0.3 /100 | #275 | Tragic $42,339 |
| Spanish Americans | 0.3 /100 | #276 | Tragic $42,316 |
| Central Americans | 0.3 /100 | #277 | Tragic $42,280 |
| Cajuns | 0.3 /100 | #278 | Tragic $42,189 |
| Colville | 0.2 /100 | #279 | Tragic $42,151 |
| Hmong | 0.2 /100 | #280 | Tragic $42,111 |
| Marshallese | 0.2 /100 | #281 | Tragic $41,969 |
| Africans | 0.2 /100 | #282 | Tragic $41,955 |
| Dominicans | 0.2 /100 | #283 | Tragic $41,864 |
| Blackfeet | 0.2 /100 | #284 | Tragic $41,822 |
| Immigrants | Nicaragua | 0.1 /100 | #285 | Tragic $41,737 |
| Mexican American Indians | 0.1 /100 | #286 | Tragic $41,719 |
| Indonesians | 0.1 /100 | #287 | Tragic $41,701 |