Immigrants from Armenia vs Russian Wage/Income Gap
COMPARE
Immigrants from Armenia
Russian
Wage/Income Gap
Wage/Income Gap Comparison
Immigrants from Armenia
Russians
20.7%
WAGE/INCOME GAP
100.0/ 100
METRIC RATING
27th/ 347
METRIC RANK
28.0%
WAGE/INCOME GAP
0.5/ 100
METRIC RATING
280th/ 347
METRIC RANK
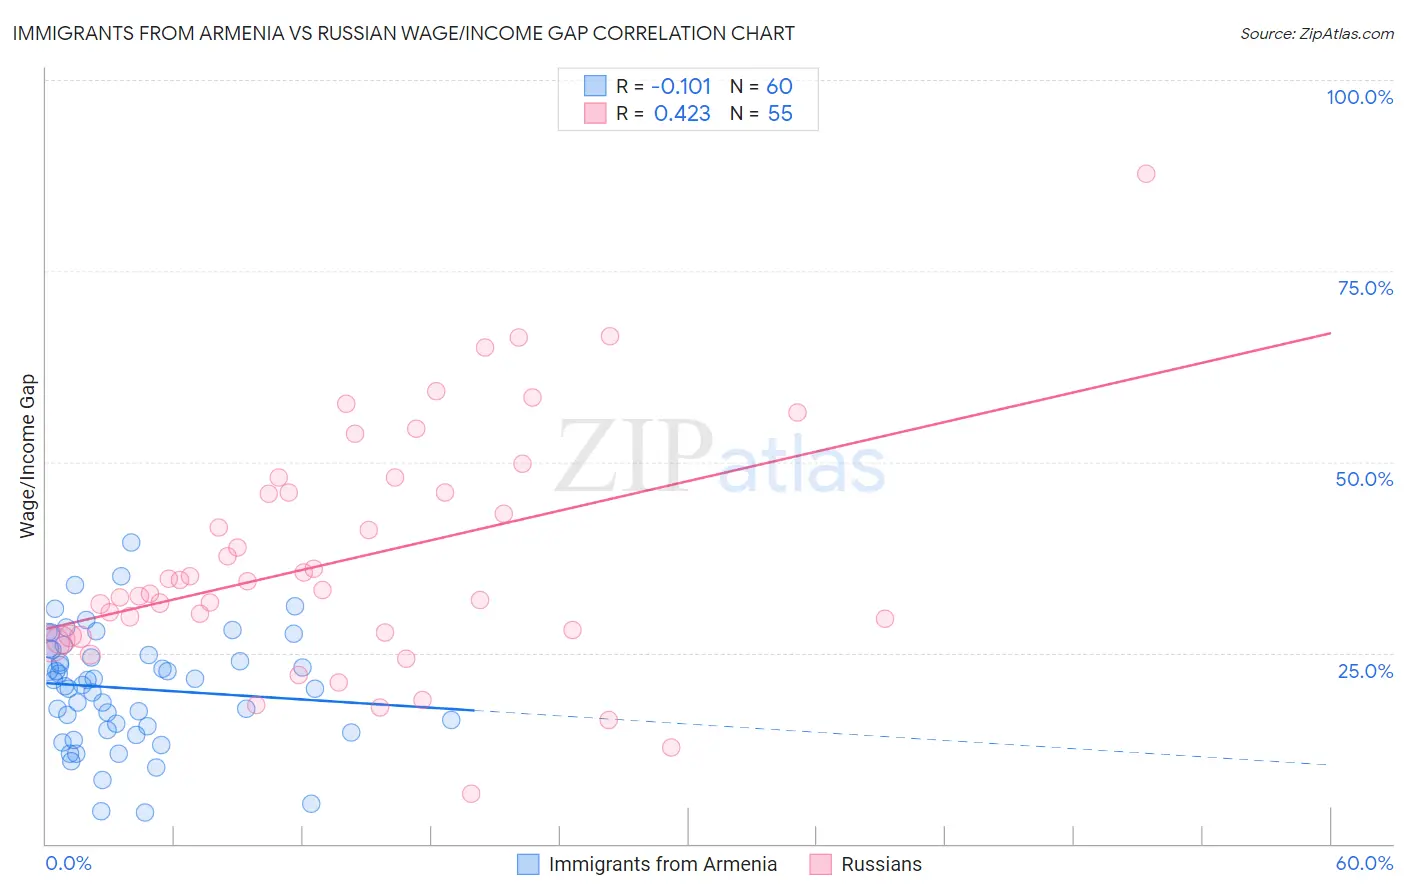
Immigrants from Armenia vs Russian Wage/Income Gap Correlation Chart
The statistical analysis conducted on geographies consisting of 97,698,839 people shows a poor negative correlation between the proportion of Immigrants from Armenia and wage/income gap percentage in the United States with a correlation coefficient (R) of -0.101 and weighted average of 20.7%. Similarly, the statistical analysis conducted on geographies consisting of 511,171,536 people shows a moderate positive correlation between the proportion of Russians and wage/income gap percentage in the United States with a correlation coefficient (R) of 0.423 and weighted average of 28.0%, a difference of 35.1%.
Wage/Income Gap Correlation Summary
| Measurement | Immigrants from Armenia | Russian |
| Minimum | 4.0% | 6.5% |
| Maximum | 39.4% | 87.7% |
| Range | 35.4% | 81.2% |
| Mean | 20.3% | 37.1% |
| Median | 21.1% | 33.2% |
| Interquartile 25% (IQ1) | 15.1% | 27.2% |
| Interquartile 75% (IQ3) | 25.0% | 46.0% |
| Interquartile Range (IQR) | 9.9% | 18.8% |
| Standard Deviation (Sample) | 7.5% | 15.5% |
| Standard Deviation (Population) | 7.4% | 15.3% |
Similar Demographics by Wage/Income Gap
Demographics Similar to Immigrants from Armenia by Wage/Income Gap
In terms of wage/income gap, the demographic groups most similar to Immigrants from Armenia are Pueblo (20.7%, a difference of 0.20%), Inupiat (20.8%, a difference of 0.23%), Senegalese (20.7%, a difference of 0.31%), Dominican (20.6%, a difference of 0.62%), and Immigrants from Dominican Republic (20.6%, a difference of 0.78%).
| Demographics | Rating | Rank | Wage/Income Gap |
| Bahamians | 100.0 /100 | #20 | Exceptional 20.2% |
| Immigrants | Caribbean | 100.0 /100 | #21 | Exceptional 20.4% |
| Immigrants | Liberia | 100.0 /100 | #22 | Exceptional 20.6% |
| Immigrants | Dominican Republic | 100.0 /100 | #23 | Exceptional 20.6% |
| Dominicans | 100.0 /100 | #24 | Exceptional 20.6% |
| Senegalese | 100.0 /100 | #25 | Exceptional 20.7% |
| Pueblo | 100.0 /100 | #26 | Exceptional 20.7% |
| Immigrants | Armenia | 100.0 /100 | #27 | Exceptional 20.7% |
| Inupiat | 100.0 /100 | #28 | Exceptional 20.8% |
| Immigrants | Senegal | 100.0 /100 | #29 | Exceptional 20.9% |
| Immigrants | Bangladesh | 100.0 /100 | #30 | Exceptional 20.9% |
| Vietnamese | 100.0 /100 | #31 | Exceptional 21.0% |
| Immigrants | Yemen | 100.0 /100 | #32 | Exceptional 21.1% |
| Immigrants | Bahamas | 100.0 /100 | #33 | Exceptional 21.1% |
| Pima | 100.0 /100 | #34 | Exceptional 21.1% |
Demographics Similar to Russians by Wage/Income Gap
In terms of wage/income gap, the demographic groups most similar to Russians are Burmese (28.0%, a difference of 0.050%), South African (28.0%, a difference of 0.080%), Romanian (28.0%, a difference of 0.15%), French Canadian (28.1%, a difference of 0.26%), and Immigrants from Sweden (28.1%, a difference of 0.26%).
| Demographics | Rating | Rank | Wage/Income Gap |
| Bulgarians | 0.7 /100 | #273 | Tragic 27.8% |
| Americans | 0.7 /100 | #274 | Tragic 27.8% |
| Immigrants | Japan | 0.7 /100 | #275 | Tragic 27.9% |
| Lebanese | 0.7 /100 | #276 | Tragic 27.9% |
| Latvians | 0.7 /100 | #277 | Tragic 27.9% |
| Immigrants | England | 0.6 /100 | #278 | Tragic 27.9% |
| Romanians | 0.5 /100 | #279 | Tragic 28.0% |
| Russians | 0.5 /100 | #280 | Tragic 28.0% |
| Burmese | 0.5 /100 | #281 | Tragic 28.0% |
| South Africans | 0.5 /100 | #282 | Tragic 28.0% |
| French Canadians | 0.4 /100 | #283 | Tragic 28.1% |
| Immigrants | Sweden | 0.4 /100 | #284 | Tragic 28.1% |
| Italians | 0.4 /100 | #285 | Tragic 28.1% |
| Immigrants | Austria | 0.4 /100 | #286 | Tragic 28.1% |
| Okinawans | 0.4 /100 | #287 | Tragic 28.1% |