Immigrants from Argentina vs Swedish Householder Income Under 25 years
COMPARE
Immigrants from Argentina
Swedish
Householder Income Under 25 years
Householder Income Under 25 years Comparison
Immigrants from Argentina
Swedes
$54,209
HOUSEHOLDER INCOME UNDER 25 YEARS
99.3/ 100
METRIC RATING
93rd/ 347
METRIC RANK
$52,986
HOUSEHOLDER INCOME UNDER 25 YEARS
87.5/ 100
METRIC RATING
143rd/ 347
METRIC RANK
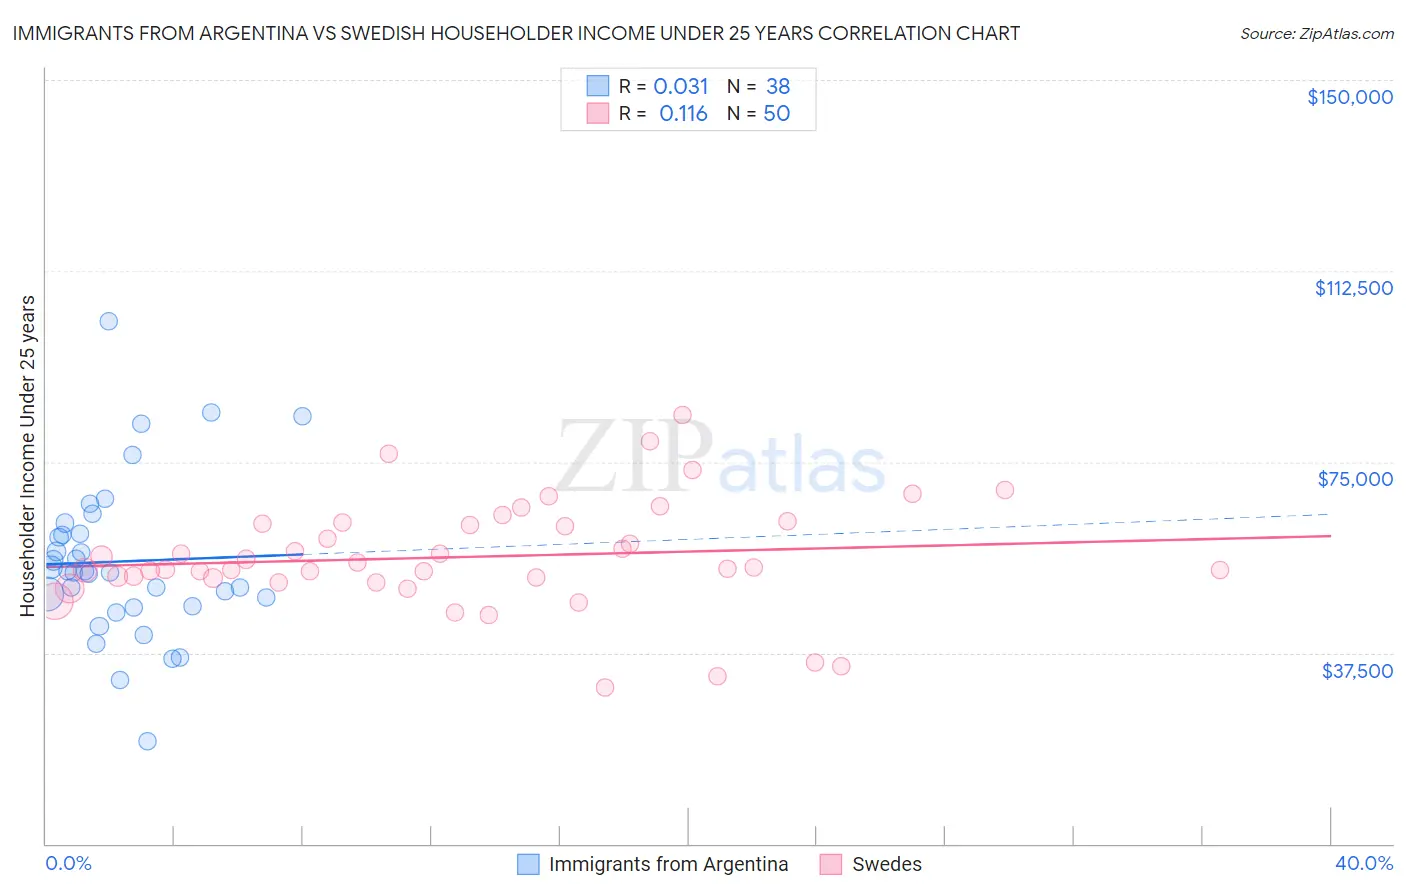
Immigrants from Argentina vs Swedish Householder Income Under 25 years Correlation Chart
The statistical analysis conducted on geographies consisting of 229,141,308 people shows no correlation between the proportion of Immigrants from Argentina and household income with householder under the age of 25 in the United States with a correlation coefficient (R) of 0.031 and weighted average of $54,209. Similarly, the statistical analysis conducted on geographies consisting of 422,891,046 people shows a poor positive correlation between the proportion of Swedes and household income with householder under the age of 25 in the United States with a correlation coefficient (R) of 0.116 and weighted average of $52,986, a difference of 2.3%.
Householder Income Under 25 years Correlation Summary
| Measurement | Immigrants from Argentina | Swedish |
| Minimum | $20,094 | $30,603 |
| Maximum | $102,571 | $84,275 |
| Range | $82,477 | $53,673 |
| Mean | $55,432 | $56,322 |
| Median | $53,374 | $54,225 |
| Interquartile 25% (IQ1) | $46,727 | $52,194 |
| Interquartile 75% (IQ3) | $60,828 | $62,766 |
| Interquartile Range (IQR) | $14,101 | $10,572 |
| Standard Deviation (Sample) | $15,762 | $10,808 |
| Standard Deviation (Population) | $15,553 | $10,700 |
Similar Demographics by Householder Income Under 25 years
Demographics Similar to Immigrants from Argentina by Householder Income Under 25 years
In terms of householder income under 25 years, the demographic groups most similar to Immigrants from Argentina are Immigrants from Sierra Leone ($54,190, a difference of 0.030%), Immigrants from St. Vincent and the Grenadines ($54,230, a difference of 0.040%), Immigrants from Egypt ($54,239, a difference of 0.050%), Immigrants from Malaysia ($54,179, a difference of 0.050%), and Turkish ($54,266, a difference of 0.10%).
| Demographics | Rating | Rank | Householder Income Under 25 years |
| Immigrants | Croatia | 99.5 /100 | #86 | Exceptional $54,343 |
| Brazilians | 99.5 /100 | #87 | Exceptional $54,335 |
| Yakama | 99.5 /100 | #88 | Exceptional $54,321 |
| Immigrants | South America | 99.4 /100 | #89 | Exceptional $54,268 |
| Turks | 99.4 /100 | #90 | Exceptional $54,266 |
| Immigrants | Egypt | 99.3 /100 | #91 | Exceptional $54,239 |
| Immigrants | St. Vincent and the Grenadines | 99.3 /100 | #92 | Exceptional $54,230 |
| Immigrants | Argentina | 99.3 /100 | #93 | Exceptional $54,209 |
| Immigrants | Sierra Leone | 99.3 /100 | #94 | Exceptional $54,190 |
| Immigrants | Malaysia | 99.2 /100 | #95 | Exceptional $54,179 |
| Argentineans | 99.2 /100 | #96 | Exceptional $54,154 |
| Immigrants | Portugal | 99.1 /100 | #97 | Exceptional $54,105 |
| Eastern Europeans | 99.0 /100 | #98 | Exceptional $54,066 |
| Alaska Natives | 98.8 /100 | #99 | Exceptional $54,000 |
| Immigrants | Kazakhstan | 98.8 /100 | #100 | Exceptional $53,990 |
Demographics Similar to Swedes by Householder Income Under 25 years
In terms of householder income under 25 years, the demographic groups most similar to Swedes are Immigrants from Armenia ($52,986, a difference of 0.0%), South American Indian ($52,979, a difference of 0.010%), Immigrants from Western Europe ($52,957, a difference of 0.050%), Danish ($53,041, a difference of 0.10%), and Hawaiian ($53,078, a difference of 0.17%).
| Demographics | Rating | Rank | Householder Income Under 25 years |
| Armenians | 91.8 /100 | #136 | Exceptional $53,179 |
| Immigrants | Barbados | 91.5 /100 | #137 | Exceptional $53,163 |
| Norwegians | 90.8 /100 | #138 | Exceptional $53,127 |
| Costa Ricans | 90.4 /100 | #139 | Exceptional $53,106 |
| Hawaiians | 89.8 /100 | #140 | Excellent $53,078 |
| Danes | 88.9 /100 | #141 | Excellent $53,041 |
| Immigrants | Armenia | 87.5 /100 | #142 | Excellent $52,986 |
| Swedes | 87.5 /100 | #143 | Excellent $52,986 |
| South American Indians | 87.3 /100 | #144 | Excellent $52,979 |
| Immigrants | Western Europe | 86.7 /100 | #145 | Excellent $52,957 |
| Immigrants | Hungary | 81.6 /100 | #146 | Excellent $52,798 |
| Latvians | 81.0 /100 | #147 | Excellent $52,783 |
| French Canadians | 76.5 /100 | #148 | Good $52,672 |
| Scandinavians | 75.7 /100 | #149 | Good $52,654 |
| Immigrants | Costa Rica | 75.2 /100 | #150 | Good $52,643 |