Colombian vs Swedish Householder Income Under 25 years
COMPARE
Colombian
Swedish
Householder Income Under 25 years
Householder Income Under 25 years Comparison
Colombians
Swedes
$53,357
HOUSEHOLDER INCOME UNDER 25 YEARS
94.6/ 100
METRIC RATING
124th/ 347
METRIC RANK
$52,986
HOUSEHOLDER INCOME UNDER 25 YEARS
87.5/ 100
METRIC RATING
143rd/ 347
METRIC RANK
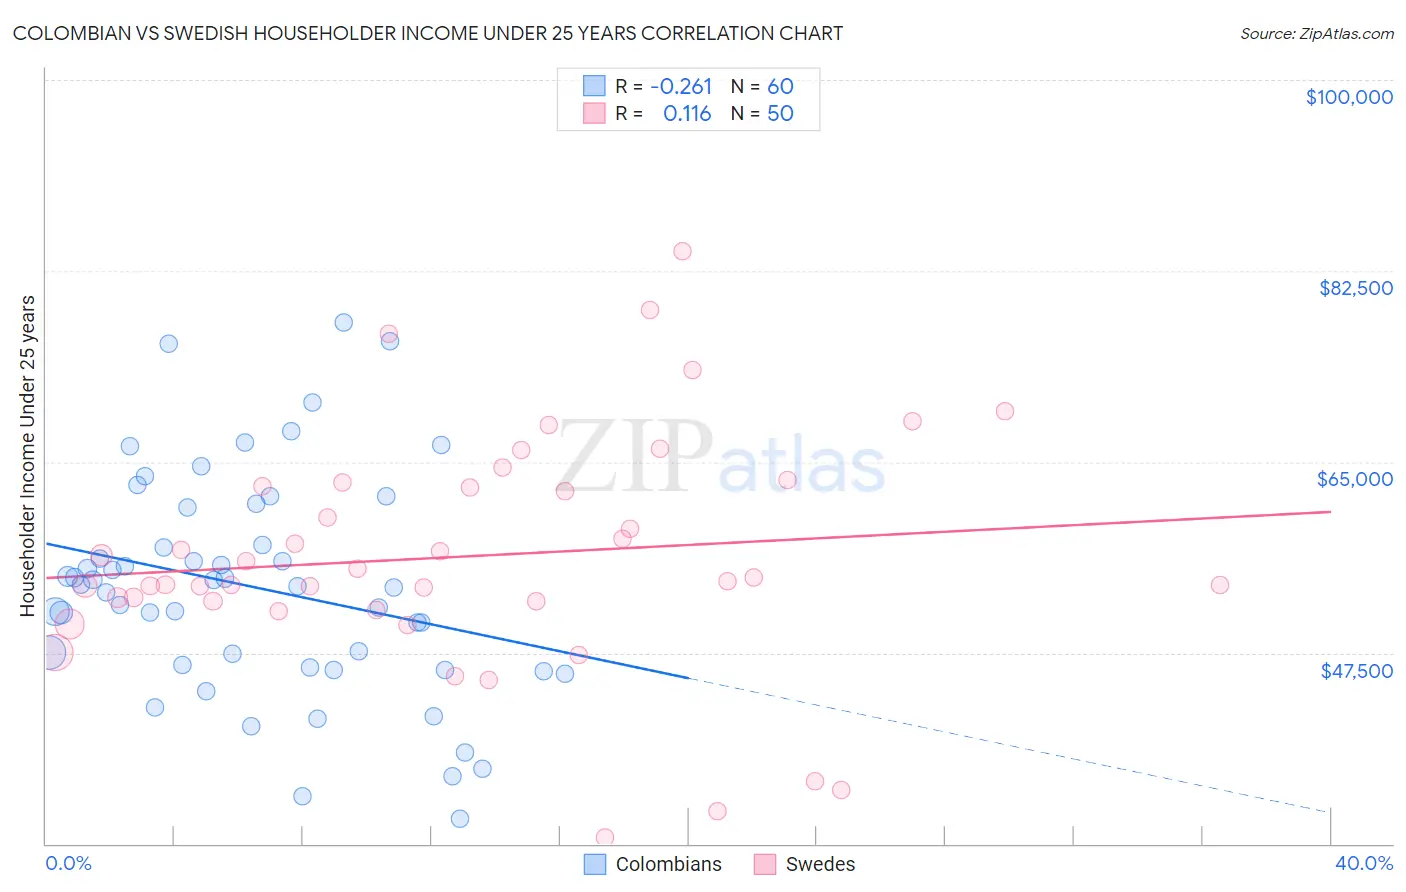
Colombian vs Swedish Householder Income Under 25 years Correlation Chart
The statistical analysis conducted on geographies consisting of 350,831,291 people shows a weak negative correlation between the proportion of Colombians and household income with householder under the age of 25 in the United States with a correlation coefficient (R) of -0.261 and weighted average of $53,357. Similarly, the statistical analysis conducted on geographies consisting of 422,891,046 people shows a poor positive correlation between the proportion of Swedes and household income with householder under the age of 25 in the United States with a correlation coefficient (R) of 0.116 and weighted average of $52,986, a difference of 0.70%.
Householder Income Under 25 years Correlation Summary
| Measurement | Colombian | Swedish |
| Minimum | $32,315 | $30,603 |
| Maximum | $77,798 | $84,275 |
| Range | $45,483 | $53,673 |
| Mean | $53,495 | $56,322 |
| Median | $53,679 | $54,225 |
| Interquartile 25% (IQ1) | $46,265 | $52,194 |
| Interquartile 75% (IQ3) | $59,118 | $62,766 |
| Interquartile Range (IQR) | $12,853 | $10,572 |
| Standard Deviation (Sample) | $10,089 | $10,808 |
| Standard Deviation (Population) | $10,004 | $10,700 |
Demographics Similar to Colombians and Swedes by Householder Income Under 25 years
In terms of householder income under 25 years, the demographic groups most similar to Colombians are Immigrants from Iraq ($53,384, a difference of 0.050%), Pakistani ($53,325, a difference of 0.060%), Immigrants from Serbia ($53,321, a difference of 0.070%), Immigrants from North America ($53,307, a difference of 0.090%), and Immigrants from Bulgaria ($53,305, a difference of 0.10%). Similarly, the demographic groups most similar to Swedes are Immigrants from Armenia ($52,986, a difference of 0.0%), Danish ($53,041, a difference of 0.10%), Hawaiian ($53,078, a difference of 0.17%), Costa Rican ($53,106, a difference of 0.23%), and Norwegian ($53,127, a difference of 0.27%).
| Demographics | Rating | Rank | Householder Income Under 25 years |
| Immigrants | Iraq | 94.9 /100 | #123 | Exceptional $53,384 |
| Colombians | 94.6 /100 | #124 | Exceptional $53,357 |
| Pakistanis | 94.1 /100 | #125 | Exceptional $53,325 |
| Immigrants | Serbia | 94.1 /100 | #126 | Exceptional $53,321 |
| Immigrants | North America | 93.9 /100 | #127 | Exceptional $53,307 |
| Immigrants | Bulgaria | 93.9 /100 | #128 | Exceptional $53,305 |
| New Zealanders | 93.7 /100 | #129 | Exceptional $53,294 |
| Nicaraguans | 93.4 /100 | #130 | Exceptional $53,275 |
| Immigrants | Nicaragua | 93.3 /100 | #131 | Exceptional $53,266 |
| Moroccans | 93.1 /100 | #132 | Exceptional $53,256 |
| Immigrants | Immigrants | 92.2 /100 | #133 | Exceptional $53,201 |
| Immigrants | Northern Africa | 91.9 /100 | #134 | Exceptional $53,185 |
| Chileans | 91.9 /100 | #135 | Exceptional $53,185 |
| Armenians | 91.8 /100 | #136 | Exceptional $53,179 |
| Immigrants | Barbados | 91.5 /100 | #137 | Exceptional $53,163 |
| Norwegians | 90.8 /100 | #138 | Exceptional $53,127 |
| Costa Ricans | 90.4 /100 | #139 | Exceptional $53,106 |
| Hawaiians | 89.8 /100 | #140 | Excellent $53,078 |
| Danes | 88.9 /100 | #141 | Excellent $53,041 |
| Immigrants | Armenia | 87.5 /100 | #142 | Excellent $52,986 |
| Swedes | 87.5 /100 | #143 | Excellent $52,986 |