Immigrants from Argentina vs European Householder Income Under 25 years
COMPARE
Immigrants from Argentina
European
Householder Income Under 25 years
Householder Income Under 25 years Comparison
Immigrants from Argentina
Europeans
$54,209
HOUSEHOLDER INCOME UNDER 25 YEARS
99.3/ 100
METRIC RATING
93rd/ 347
METRIC RANK
$51,796
HOUSEHOLDER INCOME UNDER 25 YEARS
27.6/ 100
METRIC RATING
181st/ 347
METRIC RANK
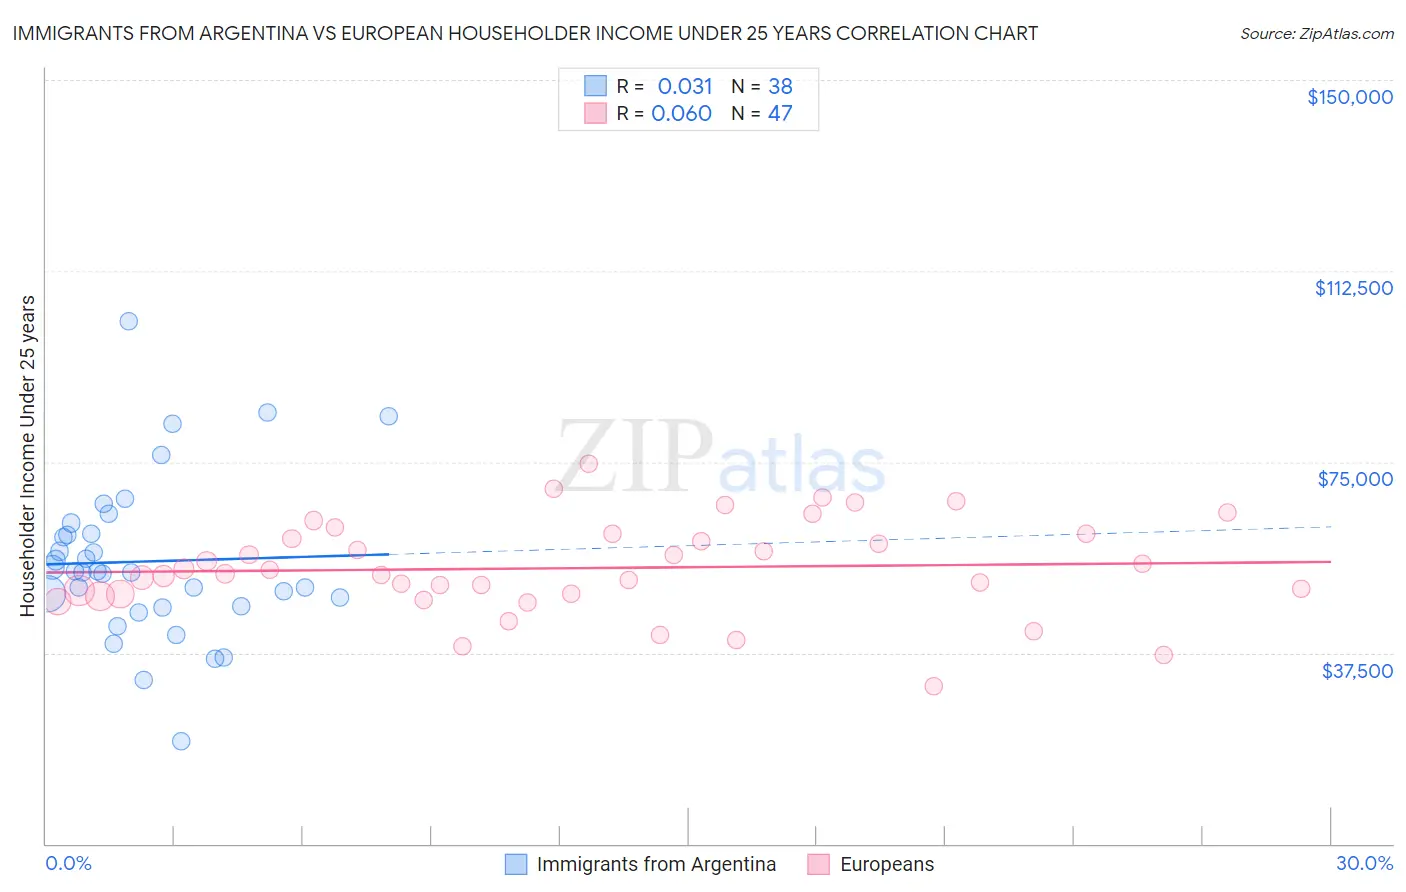
Immigrants from Argentina vs European Householder Income Under 25 years Correlation Chart
The statistical analysis conducted on geographies consisting of 229,141,308 people shows no correlation between the proportion of Immigrants from Argentina and household income with householder under the age of 25 in the United States with a correlation coefficient (R) of 0.031 and weighted average of $54,209. Similarly, the statistical analysis conducted on geographies consisting of 435,978,003 people shows a slight positive correlation between the proportion of Europeans and household income with householder under the age of 25 in the United States with a correlation coefficient (R) of 0.060 and weighted average of $51,796, a difference of 4.7%.
Householder Income Under 25 years Correlation Summary
| Measurement | Immigrants from Argentina | European |
| Minimum | $20,094 | $30,833 |
| Maximum | $102,571 | $74,701 |
| Range | $82,477 | $43,868 |
| Mean | $55,432 | $54,127 |
| Median | $53,374 | $52,957 |
| Interquartile 25% (IQ1) | $46,727 | $49,051 |
| Interquartile 75% (IQ3) | $60,828 | $60,889 |
| Interquartile Range (IQR) | $14,101 | $11,838 |
| Standard Deviation (Sample) | $15,762 | $9,259 |
| Standard Deviation (Population) | $15,553 | $9,160 |
Similar Demographics by Householder Income Under 25 years
Demographics Similar to Immigrants from Argentina by Householder Income Under 25 years
In terms of householder income under 25 years, the demographic groups most similar to Immigrants from Argentina are Immigrants from Sierra Leone ($54,190, a difference of 0.030%), Immigrants from St. Vincent and the Grenadines ($54,230, a difference of 0.040%), Immigrants from Egypt ($54,239, a difference of 0.050%), Immigrants from Malaysia ($54,179, a difference of 0.050%), and Turkish ($54,266, a difference of 0.10%).
| Demographics | Rating | Rank | Householder Income Under 25 years |
| Immigrants | Croatia | 99.5 /100 | #86 | Exceptional $54,343 |
| Brazilians | 99.5 /100 | #87 | Exceptional $54,335 |
| Yakama | 99.5 /100 | #88 | Exceptional $54,321 |
| Immigrants | South America | 99.4 /100 | #89 | Exceptional $54,268 |
| Turks | 99.4 /100 | #90 | Exceptional $54,266 |
| Immigrants | Egypt | 99.3 /100 | #91 | Exceptional $54,239 |
| Immigrants | St. Vincent and the Grenadines | 99.3 /100 | #92 | Exceptional $54,230 |
| Immigrants | Argentina | 99.3 /100 | #93 | Exceptional $54,209 |
| Immigrants | Sierra Leone | 99.3 /100 | #94 | Exceptional $54,190 |
| Immigrants | Malaysia | 99.2 /100 | #95 | Exceptional $54,179 |
| Argentineans | 99.2 /100 | #96 | Exceptional $54,154 |
| Immigrants | Portugal | 99.1 /100 | #97 | Exceptional $54,105 |
| Eastern Europeans | 99.0 /100 | #98 | Exceptional $54,066 |
| Alaska Natives | 98.8 /100 | #99 | Exceptional $54,000 |
| Immigrants | Kazakhstan | 98.8 /100 | #100 | Exceptional $53,990 |
Demographics Similar to Europeans by Householder Income Under 25 years
In terms of householder income under 25 years, the demographic groups most similar to Europeans are Jordanian ($51,796, a difference of 0.0%), Mexican American Indian ($51,783, a difference of 0.030%), Basque ($51,818, a difference of 0.040%), Immigrants from England ($51,817, a difference of 0.040%), and Finnish ($51,827, a difference of 0.060%).
| Demographics | Rating | Rank | Householder Income Under 25 years |
| Immigrants | Western Asia | 50.0 /100 | #174 | Average $52,190 |
| Immigrants | Zimbabwe | 33.8 /100 | #175 | Fair $51,914 |
| Austrians | 32.9 /100 | #176 | Fair $51,898 |
| British West Indians | 30.0 /100 | #177 | Fair $51,844 |
| Finns | 29.2 /100 | #178 | Fair $51,827 |
| Basques | 28.7 /100 | #179 | Fair $51,818 |
| Immigrants | England | 28.7 /100 | #180 | Fair $51,817 |
| Europeans | 27.6 /100 | #181 | Fair $51,796 |
| Jordanians | 27.6 /100 | #182 | Fair $51,796 |
| Mexican American Indians | 27.0 /100 | #183 | Fair $51,783 |
| Paiute | 25.1 /100 | #184 | Fair $51,743 |
| Immigrants | Latvia | 24.8 /100 | #185 | Fair $51,737 |
| Alaskan Athabascans | 23.8 /100 | #186 | Fair $51,713 |
| Immigrants | South Africa | 23.4 /100 | #187 | Fair $51,705 |
| Northern Europeans | 22.2 /100 | #188 | Fair $51,678 |